COVID origins debate: Response to Scott Alexander

The following is a response to Scott Alexander’s post about Rootclaim’s debate on the origins of Covid-19.

Prelude

We were initially excited to have Scott cover the story, hoping that someone with an affinity to probabilities would like to dig into our analysis and fully understand it. Sadly, Scott seemingly hadn’t enough time to do so and our exchange focused on fixing factual mistakes in earlier drafts of his post and explaining why rules-of-thumb in probabilistic thinking that he proposed do not work in practice. We did not get to discuss the details of our analysis, resulting in a post that is essentially a repeat of the judges’ reports with extra steps.

His post has two main messages:

  1. It’s hard to get probabilistic inference right – we fully agree with this and ironically his post is a great example, containing many probabilistic inference mistakes, some of which are listed below. While we agree it’s hard, our experience taught us that it is far from impossible.
  2. Zoonosis is a more likely hypothesis due to being better supported by the evidence –  This is completely untrue, but to fully understand it one has to commit to learning how to do probabilistic inference correctly, which Scott could not free enough time to do.

Instead of explaining the whole methodology and how it applies to Covid origins, which will take too long, we will focus on the main mistake in all the analyses in Scott’s post – believing that the early cluster of cases in the Huanan Seafood Market (HSM) is strong evidence for zoonosis. Scott prepared a very useful table comparing the probabilities various people gave to the evidence about Covid origins (discussed later in more details). It nicely shows how the zoonosis conclusion stands on this single leg, and once it is removed, lab-leak becomes the winning hypothesis (Specifically, Scott will flip to 94% lab-leak).

Having explained this many times in many ways, we realize by now that it is not easy to understand, but we promise that those who make the effort will be rewarded with a glimpse of how much better we can all be at reasoning about the world, and will be able to reach high confidence that Covid originated from a lab.

Given this point’s importance, we will explain why HSM is negligible as evidence in three levels of detail: a simple version, a summarized version and a detailed version.

Simple version

  1. The zoonosis hypothesis fully depends on the claim that it is an extreme coincidence that the early Covid patients were in HSM – a market with wildlife – unless a zoonotic spillover occurred there. 
  2. The rest of the evidence strongly supports the lab-leak hypothesis, so if this claim is mistaken, lab-leak becomes the most likely hypothesis.
  3. There are multiple cases where a country has had zero Covid cases for a while, and then a cluster of cases appears in a seafood market. In all these outbreaks, there is no contention that the source is not zoonotic, as it is genetically descended from the Wuhan outbreak.
  4. Since zero Covid periods are fairly rare, it is impossible to have so many market outbreaks unless there is something special about these locations. We discuss below what that may be, but whatever it is, it likely also applies to HSM, which is the largest seafood market in central China.
  5. This collapses the ‘extreme coincidence’ claim, which as explained above, turns lab-leak into the leading hypothesis.

Summarized version

  1. There is no contention that the strength of evidence is measured by the ratio of the conditional probabilities of that evidence under the different hypotheses – how likely are we to encounter such evidence assuming a certain hypothesis is true (Known as the Bayes factor or likelihood ratio). 
  2. We will examine the conditional probability of an HSM early cluster given that we already know a pandemic has started in Wuhan. In shorthand, we are comparing
    p(HSM|Zoonosis,Wuhan) to p(HSM|Lab Leak,Wuhan).
  3. p(HSM|Lab Leak,Wuhan) – The mistake everyone makes here is thinking this is a 0.1% to 0.01% coincidence, usually justified by the first officially confirmed case being an HSM shrimp vendor, one of 1000 HSM vendors, out of 10 million Wuhan residents.
  4. We use three independent methods to estimate this probability more accurately, all pointing to this number being larger than 1%. As this is the short version, here is the simplest way to see it: HSM is not such a coincidence since seafood markets and facilities repeatedly form early clusters.
    1. 2 out of 5 large outbreaks in China in 2020, as well as outbreaks in Thailand and Singapore, started in markets. 
    2. Most notable among them is the December 2020 outbreak in Thailand, following a long period of zero Covid (i.e. forming an early cluster just like HSM). That too happened in a seafood market, and the index case there was also a shrimp vendor!
      Given that there are not that many early clusters after zero Covid (different from just any superspreader event!), having one so similar is enough to understand HSM is not some random location that can be evaluated with a naive division of population numbers.
  5. p(HSM|Zoonosis,Wuhan) – On the other hand, markets are not such a likely location for zoonotic spillovers. The “we told you so” statements about markets are mostly hindsight bias. When examining data prior to 2020 (more below), we see that scientists warned of interfaces where people dealt much more closely with animals, such as in farms, restaurants and labs. And indeed, in the first SARS epidemic, spillovers mostly occurred in restaurants.
    So, given that markets are just one of many possible spillover locations, and HSM was not the only market with wildlife in Wuhan, we calculate (below) a conditional probability of 3-5%.
  6. At this point, what was claimed to be 10,000x evidence (increases the odds of the zoonosis hypothesis by 10,000), turns out to be less than 5x – Because, as explained in 1, we need to divide the two conditional probabilities, which are at best 5% and 1%, giving a ratio lower than 5x.
  7. Last, the remarkable lack of evidence for a wildlife spillover in HSM, despite an extensive search, further reduces this factor.
  8. The HSM early cluster is therefore negligible as evidence. Our analysis assigns it 2x.

Long Version

This section will expand on the important points above, providing more evidence to support them, and a deeper understanding of why this is the best way to approach this question.

How to quantify probabilities – Why all hypotheses must be steelmanned

The text below is copied from one of our previous blog posts.

The mistake of assigning extreme likelihoods, such as those assigned to HSM by the proponents of Zoonosis, is similar to strawmanning in human debate and can demolish an otherwise valid probabilistic analysis. Following is a semi-formal definition of the problem and how to avoid it:

  1. Our goal in a probabilistic analysis is to estimate Bayes factors.
  2. A Bayes factor is the ratio of conditional probabilities.
  3. A conditional probability p(E|H) is the probability the evidence E will occur, assuming H is true.
  4. In real-world situations, there are many ways E can occur, so p(E|H) should integrate over all those ways (using “1−∏(1−pi)”).
  5. In practice, focusing only on the most common way is usually accurate enough, and dramatically reduces the required work, as real-world data tends to have extreme distributions, such as a power law distribution. 
  6. This is the “best explanation” – the explanation that maximizes the likelihood of the hypothesis – and making a serious effort to find it is steelmanning. 
  7. A mistake in this step, even just choosing the 2nd best explanation, could easily result in orders-of-magnitude errors.
  8. To reduce such mistakes, it is crucial to seriously meet the requirement above of “assuming H is true”. That is a very unintuitive process, as humans tend to feel only one hypothesis is true at any time. Rational thinkers are open to replacing their hypothesis in the face of evidence, but constantly switching between hypotheses is difficult.
  9. The example we like to give for choosing a best explanation is in DNA evidence. A prosecutor shows the court a statistical analysis of which DNA markers matched the defendant and their prevalence, arriving at a 1E-9 probability they would all match a random person, implying a Bayes factor near 1E9 for guilty.
    But if we try to estimate p(DNA|~guilty) by truly assuming innocence, it is immediately evident how ridiculous it is to claim only 1 out of a billion innocent suspects will have a DNA match to the crime scene. There are obviously far better explanations like a lab mistake, framing, an object of the suspect being brought by someone to the scene, etc. The goal is to truly seek which explanation is most likely for each hypothesis, using the specifics of each case.
  10. Furthermore, it’s important to not only find the best explanation but honestly think about how well we understand the issue and estimate how likely it is there is some best explanation that still evades us (i.e. that we are currently estimating the 2nd best explanation or worse). This too is obvious to researchers who know not to go publish immediately upon finding something, but rather go through rigorous verification that their finding doesn’t have some other mundane explanation.
  11. So, the more complex the issue is, and the weaker our understanding of it, the less justified we are in claiming a low conditional probability. In frequentist terms, the question we should ask ourselves: How often did I face a similar issue only to later find there was a much more mundane explanation? Suppose it’s 1 in 10, then the lower bound on our p is 0.1 times however frequent that mundane explanation happens (say 0.2, for a total of 0.02)
    Claiming something like p=0.0001 in a situation where we don’t have a perfect understanding of the situation is a catastrophic mistake.
  12. For well-designed replicated physics experiments p could reach very low (allowing for the five sigma standard), but when dealing with noisy complex systems involving biology, human behavior, exponential growth, etc. it is extremely hard to confidently claim that all confounders (i.e. better explanations for the finding) were eliminated, so claiming a very low p is an obvious mistake.
  13. The last guideline is to also examine our confidence in our process. As we examine best explanations, we also need to account for the possibility that we made mistakes in that process itself.
    Suppose the explanations for the DNA match are only “by chance” and “lab mix-up”, and suppose we examined the lab procedures and talked to staff and determined a mix-up was very unlikely, it still doesn’t make “by chance” the most likely explanation, since it is still possible our analysis was wrong, and the combined probability of our mistake and a mix-up (say 0.01*0.01) is still much higher than a chance match (1E-9).

To summarize: Estimating the Bayes factor requires estimating conditional probabilities, which requires finding the best explanation under each hypothesis, which can easily succumb to several pitfalls that cause catastrophic errors. To avoid those: a) Seek and honestly evaluate best explanations under the assumption the hypothesis is true, b) Estimate the likelihood that there is some better explanation that is yet to be found – the more complex the issue is, the higher the likelihood, and c) Estimate the likelihood of mistakes in the estimates themselves.

How to measure p(HSM|Lab Leak, Wuhan)

Given the insights above, we need to put a serious effort into finding the most likely reason an early cluster of Covid cases would form at HSM. 

The reason this question focuses on an early cluster is because early isolated cases of Covid are unlikely to be detected – either a) the person doesn’t even get treated, or b) there is no reason to think they have a new pandemic virus without expensive diagnosis and research (especially true during flu season). 

Only a cluster of cases in the same location with enough severely ill people is likely to get noticed, especially if it happens to be in a location with wildlife.

We provide three methods to estimate this number, all of them supporting a conclusion that this conditional probability is over 1%. Given that each of these provides a minimum estimate, and some are independent alternative explanations for an HSM cluster, a reasonable final estimate would be 5-10%. We still conservatively assign it 1%, which is enough to make this evidence negligible.

Method 1 – Factors in HSM

HSM is not some random location in Wuhan, and it has a number of environmental factors that significantly increase the likelihood of forming an early Covid cluster compared to other busy locations:

  • High traffic, making an initial infection likely in the early stages of the pandemic. With 10,000 visitors a day, having a first infection becomes likely when there are still only a couple hundred infected all over Wuhan.
  • Many permanent residents (over 1,000 tenants) who can amplify the virus locally. This is essential in order to have enough cases in the same place that would form a cluster that health professionals will notice. There aren’t that many such locations in a city.
  • Many cold wet surfaces, which allow the virus to survive for weeks rather than hours.
  • Enclosed space, with low ventilation. Interestingly, the area of HSM with more positive samples, which some tried to associate with the wildlife stores, also happens to be the least ventilated area, with no connection to the outside.
  • Low hygiene, visible in photos and videos of the market before the shutdown.
  • A mahjong hall frequented by the vendors, which could act as an internal superspreading location, greatly accelerating initial infections. Indeed, many of the earliest cases played mahjong (page 44 here).

Importantly, most of these factors have an exponential contribution, meaning that even a mild advantage could cause HSM to host a large portion of total cases within just a few weeks.

The probability of HSM forming an early cluster, given human infections in Wuhan, is estimated as follows:

  • First we count how many locations in Wuhan could form an early cluster. For this we need a location that has the following parameters simultaneously:
    • Enough permanent residents that they could produce enough hospitalized cases to make the cluster noticeable – this excludes locations like public transportation and small offices and buildings.
    • The permanent residents need to interact enough to infect each other – this excludes locations like apartment buildings.
    • Has enough incoming traffic to catch an infection early in the pandemic – this excludes most offices and factories that don’t serve customers.
    • Has conditions that allow rapid exponential growth within the population – this excludes hospitals, which have good hygiene and isolation practices, open-air markets, and schools with young people who are unlikely to infect each other.
  • The famous paper by Worobey et al. attempted a similar analysis and concluded that 1676 sites in Wuhan were superior to HSM in terms of superspreading potential. We looked at their data in detail and found that it was based on several false assumptions. In fact, given the above requirements, we couldn’t identify a single location in their list that was superior to HSM.
    Large hospitals are the only plausible locations, as they have many permanent residents (staff and patients), and are likely to receive early cases. Still they’re trained in hygiene and controlling respiratory diseases, and anyway, there are only a handful of large hospitals in Wuhan, so they have little effect on the estimate. 
  • Turning these insights into a number: There should be at most a few thousand places the size of HSM or larger (since it houses 1/10000 of Wuhan’s population, and most people are not part of a large organization). Given that each of the above factors eliminates a significant portion of such locations, we should at most be left with 100, giving a final probability of over 1%.

Method 2 – Other SARS 2 early clusters

As previously explained, the zoonosis case relies on the claim that only once in a few thousand non-zoonotic outbreaks, would the first detected cluster be associated with a market like HSM. Contrary to this claim, an empirical analysis reveals that seafood markets and facilities repeatedly formed initial Covid clusters following a period of zero infections. This was observed in 2 out of 5 large outbreaks in China in 2020 (Xinfadi and Dalian), as well as in outbreaks in Thailand and Singapore:

  • For the Xinfadi outbreak in June 2020: among the 368 persons isolated and treated, 272 (73.9%) had epidemiologic links to the market—169 (46%) were market workers and 103 (28%) were visitors. All the remaining 96 (26%) were close contacts of the other cases. More specifically, the seafood market within Xinfadi had the most infections.
    Incidentally, this is markedly different from HSM, where most of the early cases could not be connected to it.
  • For the Dalian outbreak in July 2020, the outbreak was in Dalian Kaiyang World Seafood, a major seafood processing facility. This was the first local outbreak reported after having no new local infections in Dalian for 111 consecutive days.
  • In Thailand in mid-December 2020, after 6 months of near zero infections, more than 1,300 cases were traced to a seafood market in Samut Sakhon, a coastal province near Bangkok.
    This case bears several eerie similarities to HSM, including the earliest case being a shrimp vendor.

“Nearby, razor wire and police guards blocked access to the Klang Koong, or Central Shrimp, seafood market — one of Thailand’s largest — and its associated housing, the epicenter of the new cluster.

Thailand’s Disease Control Department said Sunday that they found 141 more cases linked to the market outbreak. On Saturday, the department reported 548 cases, Thailand’s biggest daily spike, sending shockwaves through a country that has seen only a small number of infections over the past several months due to strict border and quarantine controls.

The new outbreak has been traced to a 67-year-old shrimp vendor at the seafood market.”

It’s important to highlight the distinct nature of these early clusters compared to regular superspreader events. Early clusters are exceptionally rare because zero Covid periods were infrequent worldwide, and typically, each period would yield only one early cluster. The occurrence of two such cases in Thailand and Singapore, as well as 2 out of 5 major clusters during China’s 2020 zero Covid period, underscores their significance.

Most likely, the cold wet surfaces abundant in seafood markets provide a major advantage compared to other crowded locations.

To estimate this probabilistically we place these four cases in the numerator of a fraction, where the denominator represents all identified early clusters following zero Covid periods. Such a denominator is not accurately known, as early clusters are not always identified or documented. Given that not many countries achieved zero Covid, and often the early cluster is not easy to find, we place an upper limit of 100, for a ratio of over 4%. There could be some differences between HSM and these markets (one possibility discussed below), leaving us enough leeway to confidently claim the conditional probability is above 1%.

Those who, like Scott, were impressed by the coincidence that the pandemic started in the city of WIV, and then were more impressed by the coincidence that it started in a market hosting wildlife, should now be even more impressed by the coincidence that a shrimp vendor is again the index case in an early cluster. How many people are shrimp vendors? 1 in 100,000?

This kind of rules-of-thumb thinking is bound to result in wrong conclusions. There is sadly no alternative to a proper rigorous probabilistic analysis of all evidence using a methodology that avoids human bias.

A common objection to this method is that these outbreaks are caused by cold-chain products brought into these markets. However, this still fails to explain why markets form these early clusters and not the many other places where cold chain products are delivered to. Additionally, this only demonstrates the importance of cold wet surfaces in preserving SARS2 infectivity, further strengthening the hypothesis in method 1 that a crowded location with many wet surfaces like HSM is highly conducive for rapid SARS2 spread. Last, it also opens the possibility that the HSM outbreak was also caused by cold-chain products. This would reduce the significance of Wuhan being the outbreak location (as the product could have come from anywhere), but since the other evidence for lab-leak is so strong, Wuhan can be given no weight and still lab-leak would be highly likely – Rootclaim’s conclusion will only drop from 94% to 92%.  

Method 3 – China CDC Move

In the debate we provided an alternative explanation for HSM forming an early cluster: It did host one of the first cases, but that was a result of the fact Wuhan CDC was moving just next to the market during the months before the outbreak, creating plenty of opportunities for a leak through WIV cooperation with CDC. For example, an infected WIV worker infects a CDC colleague who goes to the market for lunch, or contaminated WIV equipment is transferred to the new CDC location and infects a mover who then visits the market.

This mistake was also made by both judges. Even if you choose to believe HSM does not have any special properties that make it a far more likely early cluster location (method 1), and you’re confident it is markedly different than the other markets that formed early clusters (method 2), that only means you need to revert to our alternative hypothesis which was that the spillover was due to the CDC move right next to HSM. While we did not view this as the best explanation, it immediately becomes the best one for anyone choosing to reject other explanations.

It is hard to provide an accurate estimate for this, but the following should be close enough:

  1. Remember we still need many permanent residents in one space for a noticeable cluster to form – such locations should not account for more than 10% of Wuhan residents.
  2. The proximity to the CDC should account for at least a 10x advantage for HSM, relative to these other locations.
  3. This makes the supposed 1/10,000 coincidence a 1/100, which again supports the 1% conditional probability estimate.

Note that these are just the three methods we identified. To continue to believe the extreme p=1/10000 or p=1/000, you also need to be very confident there aren’t other explanations that were not yet identified. More generally, such extreme numbers are not possible outside very controlled environments where all confounders can be reliably eliminated (more on this below).

In more intuitive terms: to claim 1:10000, it is insufficient to state, “I didn’t see enough evidence to be convinced HSM is not some random location in Wuhan.” Instead, one must assert that “The claim that the conditions in HSM make it a likely location for an early cluster is utterly ridiculous. I understand this claim so deeply that I attribute less than 1% chance of it being true. (Otherwise, that becomes a superior explanation, at 1% * 1%) Furthermore, I analyzed all other initial clusters in seafood markets and facilities in China, Thailand, and Singapore. I am over 99% certain that these clusters are entirely distinct from HSM and do not increase the likelihood of its origin. Additionally, I evaluated all alternative hypotheses, such as the CDC’s proximity to HSM, and found that there is almost no chance that they would cause a leak. Additionally, I analyzed the outbreak dynamics thoroughly and am over 99% convinced that there are no other strong biases towards HSM that have not yet been discovered.”

There is simply no way to achieve this level of confidence.

How to measure p(HSM|Zoonosis, Wuhan)

We should now do the same for the other conditional probability. Here the common mistake is to miss the hindsight bias in assuming HSM is a likely spillover location, given zoonosis. The most prominent example is pointing to a photo of a raccoon dog that a virologist had taken in HSM years before, implying there was some premonition.

On the surface this may look like steelmanning – searching for a way to assign a high conditional probability. But steelmanning doesn’t mean just making up reasons for a high number. We need to find the highest number that can be reliably supported. 

The raccoon dog photo and the identification of wildlife in HSM don’t meet that requirement as they are a result of hindsight bias.

First, there is no premonition in the raccoon dog photo. The virologist visited HSM because he was visiting WIV, and it is the largest wet market in Wuhan. Ironically, the photo actually demonstrates yet another possibility for how a WIV leaked virus can reach HSM.

Second, the picture was noted after the outbreak, so we can’t quantify its significance without evaluating how many other things did virologists document, which would seem interesting in hindsight

Same goes for wildlife in HSM. How many locations other than markets provide an interface with wildlife? Were markets actually identified in advance to be high-risk spillover locations or only in retrospect?

Following a question on this from Scott, we decided to dig further and did an unbiased search to better estimate the strength of this coincidence, as follows:

  1. Searched [wildlife -Covid “spillover locations”] prior to 2019.   
  2. The fourth result was the first to have relevant information. It was the famous PREDICT plan by USAID (PDF). 
  3. Scanned for relevant mentions
  4. This is the most relevant quote. Markets are not mentioned.
    High-risk interfaces for zoonotic viruses transmitted by direct and indirect contact transmission included contact with wild animals in and around their dwellings and in agricultural fields (Figure 6). Occupational exposure associated with working with wild animals (veterinarians, researchers, and workers in laboratories) was also frequently reported. 
  5. This text repeats several times with variations, including one instance where it discusses which locations should be surveilled, and proposes to expand the search to more locations, only then suggesting markets, indicating these are a lower priority risk:
    Other interfaces were also targeted by surveillance to more fully investigate and rank risks for potential virus transmission, including wild animal farms; markets and restaurants; other sites on the food value chain; sites with ecotourism; and wildlife preying on livestock, raiding crops, and causing public safety hazard. 
  6. Although markets are mentioned many times throughout the document, they are mostly discussed in relation to prevention rather than spillover because they are easy to regulate. 
  7. Markets are also mentioned as one of the spillover locations for SARS1. To estimate the rate there we have a more specific study. It found that out of 23 early cases, 9 were connected to wildlife. Of these, 7 were restaurant chefs, one bought produce for a restaurant (so visited markets but didn’t work there), and one sold snakes at a market.

The relevant study cited in PREDICT includes a passage that identifies markets as one of twelve potential spillover locations:

“Transmission interfaces involving wildlife were stratified by direct and indirect contact transmission and summarized in categories describing human contact as follows i) wild animals in and around human dwellings, ii) wild animals hunted, iii) wild animals consumed, iv) wild animals kept as pets, v) wild animals housed in laboratories, vi) wild animals sold in markets, vii) wild animals kept in zoos and sanctuaries, viii) wild animal exposure during agricultural activities, ix) wild animal exposure during ecotourism activities, x) wild animal exposure during wildlife management activities in protected areas, xi) virus exposure in laboratory settings (lab pathogen) and xii) virus exposure via contaminated water.”

It is somewhat ironic that prior to Covid, labs were considered a more likely spillover location than markets.

Finally, we’ll try to quantify the conditional probability of an HSM spillover and early cluster, assuming zoonosis as the origin and Wuhan as the location, given this data:

  1. Markets are listed as one of 12 spillover locations, and in lower priority.
  2. A similar number is known from SARS1 where we have 1 out of 9 wildlife related cases being in a market. There were 14 more where the connection to wildlife is unknown so it likely happened in some rural location.
  3. HSM is only one of 4 markets with wildlife in Wuhan, albeit the largest one.
  4. A spillover at HSM does not necessarily mean the early cluster will form there, but it’s likely, so we’ll ignore that.

Multiplying the share of markets (1 and 2) by the share of HSM within markets (3), we converge to around 3-5%. 

Our original estimate was that HSM should account for 10% of zoonotic spillover cases in Wuhan. Following this more detailed analysis we now realize this was too high. In most cases, an animal-to-human transmission would not result in the first cluster occurring in a wildlife location at all. The spillover would likely occur in some rural area, unnoticed, and then spread to Wuhan (or another city) through human contact, until forming a noticeable cluster somewhere. Interestingly, this may mean that even if SARS2 was zoonotic in origin, it is unlikely that the spillover happened in HSM!

Advanced note: This analysis is a bit simplified as it doesn’t take into account that Wuhan has much less of these interfaces than other places in China (a city doesn’t have many farms, and wildlife consumption is not popular outside south China). However this cancels out with the prior of having the outbreak start in Wuhan. Since we didn’t discount the prior of Wuhan due to this lower risk, any increase in one will need to be accompanied by a decrease in the other. To keep it simple, we ignore it in both.

The remarkable lack of evidence

The absence of evidence for any involvement of wildlife in the HSM outbreak seems hard to explain.

  1. All the animal samples in the market or the farms supplying it were negative.
  2. No evidence of positive infections among animal vendors, not even rumors.
  3. Early infections are distributed uniformly across the West side of the market. They are not centered on any interesting location. This is more compatible with early infections coming from the mahjong room – matching the multiple reports of early cases being mahjong players.
  4. Animal cages don’t have high SARS2 reads, whereas several stalls with infected vendors do.
  5. Positive SARS2 environmental samples are not positively correlated with wildlife stalls or wildlife genetic material.

This is in addition to the following evidence contradicting an HSM spillover in general: 

  1. Majority of early cases could not be connected to the market. This is in contrast to the later outbreak in Beijing, where 100% of cases could be traced to the market.
  2. Chen and Connor Reed are both indicative that the earliest cases are not in the market. While there is some uncertainty about each of them alone, together they are fairly strong. 
  3. Market cases are all from lineage B, while there are many cases with the more ancestral lineage A outside the market.

Some of these claims are contested by the other side and we included only those that we’re confident in – see a more detailed discussion below.

Specific comments

Following are comments on specific statements in Scott’s post. While of lesser importance compared to the main mistake above, they may help get a better understanding on the origins of Covid and how to better do probabilistic inference.

About Sore losing

We’d like to place this comment first (the rest are in the order they appear), as it is a repeating complaint we get that we are ‘doubling down’ on a bad decision, by not changing our conclusion to zoonosis following the loss of the debate.

Scott writes:

Saar says the debate didn’t change his mind. In fact, by the end of the debate, Rootclaim released an updated analysis that placed an even higher probability on lab leak than when they started.

In his blog post, he discussed the issues above, and said the judges had erred in not considering them. He respects the judges, he appreciates their efforts, he just thinks they got it wrong. Although he respected their decision, he wanted the judges to correct what he saw as mistakes in their published statements, which delayed the public verdict and which which Viewers Like You did not appreciate:

Referring to this manifold market blaming us of being sore losers, because we didn’t update our analysis towards zoonosis (It additionally correctly criticized an initial 99.8% probability, which was due to a rushed sensitivity analysis that was quickly corrected, giving 94%).

This is a misunderstanding of what Rootclaim does. All we do is implement a methodology for minimizing probabilistic inference mistakes. We improve it over time with experience, and at this point are very confident it is superior to any other inference method.

Our conclusions are the result of running the methodology on the evidence. For the conclusion to change there needs to be an update in either the methodology or the evidence.

The debate hardly discussed the methodology nor our Covid origins probabilistic model, so it didn’t provide any helpful feedback in that aspect. It did allow us to more deeply understand the evidence, which we definitely updated in the new version of our analysis. 

Reading the judges’ reports was also unhelpful, as the probabilistic inference mistakes there were patently obvious to us (remember we’re doing this for over a decade). We published a report on these mistakes, and so far no one was able to point to any problem with it.

So, to be clear – We fully integrated into our new analysis all the new information from the debate as well as the feedback we received following the debate. It so happened that it strengthened the probability of a lab-leak rather than weakened it. We understand this looks from the outside as stubborn, sore losing, or unscientific, but there’s not much we can do – that is the process we follow, and this is its result. We won’t publish a bad analysis just to look noble.

Spatial spread of environmental samples in HSM

Scott shows a map of the environmental samples taken in HSM and explains this supports zoonosis (note he confuses cases and samples here):

A map of cases at the wet market itself shows a clear pattern in favor of the very southwest corner:

The southwest corner is where most of the wildlife was being sold. Rumor said that included a stall with raccoon-dogs, an animal which is generally teeming with weird coronaviruses, and is a plausible intermediate host between humans and bats:

However, this interpretation is misleading as it primarily reflects increased sampling in the area where wildlife is sold. Once this is corrected, the chart becomes less impressive. When you consider there are likely also implicit biases, such as more meticulous sampling in wildlife stalls, or resampling after receiving a ‘surprising’ negative sample, it’s clear this map has little evidential weight.

Incidentally, while preparing for the debate, we discovered this area also happens to be the least ventilated in HSM.

Why cases are not centered around WIV

Scott quotes Peter, who implies that under the lab-leak hypothesis, we would expect the confirmed early cases to be centered around the WIV.

Peter: The first officially confirmed Covid case was a vendor at the Wuhan wet market. So were the next four, and half of the next 40. A heat map of early cases is obviously centered on the wet market, not on the lab. 

However, cases are not expected to center on the lab. The lab is not spraying viruses into the air or hosting thousands of locals daily. If a worker gets infected, they spread the virus to their friends and family at completely different locations.

About claims made from early case data

This is a good place for a general comment about any claims made from the early case data provided by Chinese authorities, which makes up for a good chunk of zoonosis claims.

The data pertaining to the early cases are unreliable and potentially manipulated, making it extremely difficult to derive clear conclusions. A detailed 194-page analysis by Gilles Demaneuf offers some insight into the matter, but our recommendation is to simply acknowledge there is great uncertainty that makes it impossible to draw any high confidence conclusions. 

What is worth noting is that China did not publish the most obvious action they should have taken, which is contact tracing of all early cases. Since it is improbable that contact tracing was not conducted, the lack of public disclosure suggests that the findings might have contained unfavorable findings.

Regarding session 1 summary

One of the main arguments we raised in the debate was not mentioned at all in Scott’s post. 

All the evidence trying to support a spillover at the market is based on complex models with many single points of failure, built from unreliable and biased data. Therefore, it is difficult to give this evidence significant weight as there is always a possibility of errors in the data or its interpretation. More on this in the UFO comment below.

The lack of infected animals

Scott quotes Peter explaining why he thinks it isn’t significant that no infected animals were found in HSM:

Peter: Raccoon-dogs were sold in various cages at various stalls, separated by air gaps big enough to present a challenge for Covid transmission, and there’s no reason to think that one raccoon-dog would automatically pass it to all the others. The statistical analysis just proves there were many raccoon-dogs who didn’t have Covid. But you only need one. 

To illustrate what a market looks like in a real zoonotic pandemic, consider this study from SARS1. The researchers went to a random market and sampled the wildlife sold there. 4 of 6 civets sampled were positive, and 3 of them were phylogenetically distinct (i.e. infected in completely different places). 

Intermediate genomes

Scott quotes Peter’s attempt to discredit intermediate sequences that contradict the zoonosis double spillover claim.

The scattered cases of “intermediates” are sequencing errors. They were all found by the same computer software, which “autofills” unsequenced bases in a genome to the most plausible guess. Because Lineage B was already in the software, depending on which part of a Lineage A virus you sequenced, you might get one half or the other autofilled as Lineage B, which looked like an “intermediate”. We know this because all the supposed “intermediates” were partial cases sequenced by this particular software. We can confirm this by noting that there are too many intermediates! That is, where Lineage A is (T/C) and Lineage B is (C/T), the software found both (T/T) “intermediates” and (C/C) “intermediates”. But obviously there can only be one real intermediate form, and we have to dismiss one or the other. But in fact we can dismiss both, because they were both caused by the same software bug.

While Peter had a good point about the C/C sequences, he was unable to provide a good explanation for the T/T sequences. And indeed new evidence indicates these are likely to be real. This alone makes an HSM spillover unlikely, delivering a major blow to the zoonosis hypothesis.

The rarity of BANAL-52

Scott explains that Covid’s closest known relative, BANAL-52, is rare and so it’s highly unlikely the WIV would’ve had it available as the starting point to engineer Covid.

“But suppose they did make more trips. Given the amount of time between the DEFUSE proposal and Covid, if they kept to their normal virus-collection rate, they would have gotten about thirty new viruses. What’s the chance that one of those was BANAL-52? There are thousands of bat viruses, and BANAL-52 is so rare that it wasn’t found until well after the pandemic started and people were looking for it very hard. So the chance that one of their 30 would be BANAL-52 is low.”

This is a basic mistake. SARS2 is not based on BANAL-52 but a relative of it. There is nothing unlikely here.

The reliability of Connor Reed

A British expatriate in Wuhan, Connor Reed, says he got sick in November, three weeks before the first wet market case. Later the hospital tested his samples and said it was Covid. Another paper reports 90 cases before the first wet market one.

Peter: The British man was lying. The case wasn’t reported in any peer-reviewed paper. It was reported in the tabloid The Daily Mail, months after it supposedly happened. He also told the Mail that his cat got the coronavirus too, which is impossible. Also, to get a positive hospital test, he would have had to go to the hospital, but he was 25 years old and almost no 25-year-olds go to the hospital for coronavirus. His only evidence that it was Covid was that two months later, the hospital supposedly “notified” him that it was. The hospital never informed anyone else of this extremely surprising fact which would be the biggest scientific story of the year if true. So probably he was lying. Incidentally, he died of a drug overdose shortly after giving the Mail that story; while not all drug addicts are liars, given all the other implausibilities in his story, this certainly doesn’t make him seem more credible. And in any case, he claimed he got his case at a market “like in the media”

  • Reed’s case is not a tabloid story. He was interviewed by dozens of other outlets, including The Guardian, and there are many video interviews of him available.
  • About his cat getting Covid: Unclear why this discredits him. Connor Reed was not a coronavirus expert. He initially believed his cat had also contracted the same virus, was later probably told that it was unlikely and corrected it to say his cat had a “feline coronavirus”. It’s also worth mentioning that contrary to Peter’s claim, cats can be infected by Covid-19
  • He went to the hospital after feeling very bad, like many young people who got pre-omicron Covid (especially expats), received medicine and was dismissed. Nothing special about it.
  • There is of course an obvious reason why his confirmed test might not be published as “the biggest scientific story of the year”.
  • The drug overdose was not “shortly after”, but a year later, after he returned to the UK, and it happened due to bad mixing of drugs with his university flatmate – not alone under a bridge. At the time he was infected, he was an English teacher in Wuhan.
  • Reed definitely did not claim he got infected at HSM. He mentioned a fish market where he does his regular shopping, which others just assumed to be HSM. This is near impossible: A single young man who lives 600m from his job would not do his ‘regular shopping’ in a wholesale seafood market that is a 3 hours round trip. Additionally, he doesn’t think he got it there, which would be weird if he regularly visited a location with hundreds of infections.

Overall, all attempts to portray him as an unstable, delusional person were unsuccessful. He is an ordinary person who very accurately described Covid-19 symptoms in real-time and claims to have received a positive test result. The timing and location matches the lab leak hypothesis and is impossible for the HSM claim. Therefore, they must discredit him.

One more thing: Reed’s case was badly misrepresented by Peter here. This was just one misrepresentation that we managed to catch, but there are likely many more that we haven’t, because our methodology allows us to focus on a small fraction of the evidence that is sufficient to reach an accurate conclusion, and invest much less effort in researching minor details.

This created the false impression that the evidence for zoonosis was richer and more reliable, which is another reason the debate swayed people towards zoonosis.

Claiming the FCS is not that unnatural

Covid’s furin cleavage site is admittedly unusual. But it’s unusual in a way that looks natural rather than man-made. Labs don’t usually add furin cleavage sites through nucleotide insertions (they usually mutate what’s already there). On the other hand, viruses get weird insertions of 12+ nucleotides in nature. For example, HKU1 is another emergent Chinese coronavirus that caused a small outbreak of pneumonia in 2004. It had a 15 nucleotide insertion right next to its furin cleavage site. Later strains of Covid got further 12 – 15 nucleotide insertions. Plenty of flus have 12 to 15 nucleotide insertions compared to other earlier flu strains.

Highly inaccurate. Despite years of focus on this weird 12nt clean insertion in SARS2, no one was able to produce anything remotely similar to it. 

To understand how ridiculous the claim is that the HKU1 insertion looks just as engineered as SARS2’s, here are their alignments. Hopefully that should be enough.

SARS2 vs closest relative: 

Full Screen Image

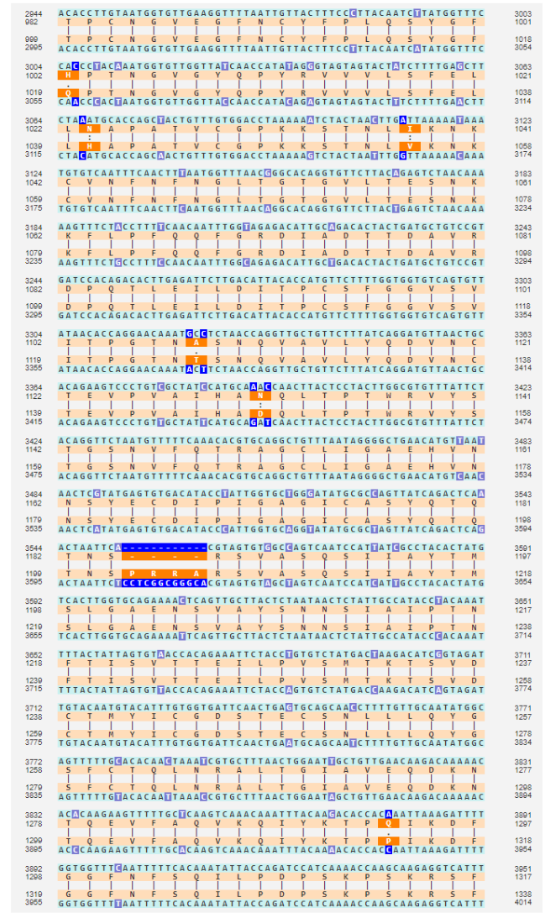
HKU1 vs closest relative:

The judges decision was not due to probabilistic inference mistakes

I’m focusing on this because Saar’s opinion is that the debate went wrong (for his side) because he didn’t realize the judges were going to use Bayesian math, they did the math wrong (because Saar hadn’t done enough work explaining how to do it right), and so they got the wrong answer. I want to discuss the math errors he thinks the judges made, but this discussion would be incomplete without mentioning that the judges themselves say the numbers were only a supplement for their intuitive reasoning.

This is confusing two different things. The judges indeed had reservations about doing a full probabilistic analysis. But they definitely relied heavily on probabilistic thinking when evaluating the strength of specific evidence, most notably in wrongfully concluding HSM is strong evidence by calculating the probability of the index case being in a group of 1000 HSM workers out of 10 million Wuhan residents. As we showed, this probabilistic inference mistake alone was enough to reach a wrong conclusion.

Are extreme likelihood ratios possible?

Saar had specific arguments against this, but he also had a more general argument: you should rarely see odds like 1/10,000 outside of well-understood domains.

Indeed, this is possible in highly controlled environments like physics experiments and computers, or when highly accurate statistics are available using a good reference class.

This is not currently the case in the origins debate, and we should therefore not see such numbers there. In the case of HSM we specifically pointed to the multiple mistakes people made in reaching this wrong number.

More in point 12 of our post here: “For well-designed replicated physics experiments p could reach very low (allowing for the five sigma standard), but when dealing with noisy complex systems involving biology, human behavior, exponential growth, etc. it is extremely hard to confidently claim that all confounders (i.e. better explanations for the finding) were eliminated, so claiming a very low p is an obvious mistake.”

Can steelmanning cause you to think the sun won’t rise tomorrow?

This makes total sense, it’s absolutely true, and I want to be really, really careful with it. If you accept this reasoning too hard you can convince yourself that the sun won’t rise tomorrow morning. All you have to do is propose 100 different reasons the sunrise might not happen. For example:

  1. The sun might go nova.
  2. An asteroid might hit the Earth, stopping its rotation.
  3. An unexpected eclipse might blot out the sun.
  4. God exists and wants to stop the sunrise for some reason.
  5. This is a simulation, and the simulators will prevent the sunrise as a prank.
  6. Aliens will destroy the sun.

…and so on until you reach 100. On the one hand, there are 100 of these reasons. But on the other, they’re each fantastically unlikely – let’s say 99.9999999999% chance each one doesn’t happen – so it doesn’t matter.

But suppose you’re good at reasoning and you realize that you should never see numbers like 99.9999999999%. You might think you have a great model of how eclipses work and you know they never happen off schedule, but can you be 99.9999999999% sure you understood my astronomy professor correctly? Can you be 99.9999999999% sure you’re not insane, and that your “reasoning” isn’t just random seizings of neurons that aren’t connecting to reality at any point? Seems like you can’t. So maybe you should lower my disbelief in each hypothesis to something more reasonable, like 99%. But now the chance that the sun rises tomorrow is 0.99^100, aka 36%. Seems bad.

As previously stated, the Rootclaim methodology has no problem reaching high probabilities in cases like these where physics are involved or strong statistics exist. It’s just not applicable to the origins question.

Neglecting dependencies in evidence

Even aside from the failure mode in the sunrise example above (where people are too reluctant to give strong probabilities), it fails because people don’t think enough about the correlations between stages. For example, maybe there’s only 1/10 odds that the Wuhan scientists would choose the suboptimal RRAR furin cleavage site. And maybe there’s only 1/20 odds that they would add a proline in front to make it PRRAR. But are these really two separate forms of weirdness, such that we can multiply them together and get 1/200? Or are scientists who do one weird thing with a furin cleavage site more likely to do another? Mightn’t they be pursuing some general strategy of testing weird furin cleavage sites?

And indeed Yuri provided a satisfying hypothesis that explains both of these:  Some sarbecoviruses have PAAR in that location, so researching its mutation into PRAR and then PRRAR is an interesting project.

It is worth noting that this would also explain the use of a 12nt insertion – It would be required for such research, as there is no ‘P’ present in the BANAL-52 family.

How strong is the FCS “coincidence”

Likewise, the furin cleavage site really is weird. I didn’t feel like either side did much math to quantify this weirdness. Naively, I might think of this as “30,000 bases in Covid, only one insertion, it’s in what’s obviously the most interesting place – sounds like 30,000-to-one odds against”. 

Here is a quick calculation of the FCS coincidence:

Based on the number of SNV mutations relative to BANAL-52, and using known statistics on long insertions, SARS2 should have only around 0.01 long insertions. Another way to appreciate this is to note that not only does SARS2 have no long insertions relative to its closest relatives, it doesn’t have any insertions, not even the far more common 3 nucleotides insertions.

Next, the probability of that clean long insertion occurring at the correct location is approximately 3000, not 30,000, due to several locations being relevant. Additionally, the sequence being from a foreign source increases the probability by about 10x. Therefore, the overall probability is approximately 1 in 30,000,000. This is before considering this is the first FCS in this family, which is harder to quantify.

This calculation has no relevance in our methodology, as the methodology requires “steelmanning” all hypotheses (as explained above) and scientists have nowhere near enough understanding of FCSs to claim a 1 in millions confidence there is no better explanation for this unique FCS. We didn’t even bother to calculate this 30 million number (as Scott laments here) until we realized people don’t understand this concept. After a decade of dealing with these problems, it is often difficult to predict what others would find easier or harder to understand.

If you use 10,000x for HSM, you must use 30,000,000x for FCS.

If you use the more accurate 25x for FCS, then you must use 2x for HSM.

No picking and choosing!

Maybe if you add in some of the evidence that other viruses have insertions here, it becomes only 100-to-one against, but that’s still a lot.

As explained above, there is no evidence of similar insertions in any other virus. 

Against that, a virus with a boring insertion would never have become a pandemic, so maybe you need to multiply this by however much viral evolution is going on in weird caves in Laos, to get the odds that at least one virus would have an insertion interesting enough to go global. Neither participant really tried to calculate this

This is of course one of the more trivial biases in probabilistic inference (texas sharpshooter / selection bias / multiple comparisons), and obviously, our methodology accounts for it in all analyses. 

In this case we solve it by focusing only on pandemic-causing viruses, and comparing the different ways they could emerge.

Rootclaim’s big picture

The problem was, Saar couldn’t effectively communicate what his big picture was. Neither deployed some kind of amazingly elegant prior. They both used the same kind of evidence. The only difference was that Peter’s evidence hung together, and Saar’s evidence fell apart on cross-examination.

This is a common theme throughout Scott’s piece, conflating Peter’s superiority in debating real time, with what the actual evidence was. When examining only the written parts where each side could research properly, and not under time pressure, we believe it’s evident that all the zoonosis claims collapse while all core lab leak claims survive.

Scott’s post further amplifies this wrong impression by choosing to end each of the four sections with Peter’s comments. Scott said he’s done this because Peter seemed to go deeper into chains of rebuttals, such that most of his evidence stood unrebutted. While Peter was indeed impressive in his memory of details, his evidence definitely did not survive deeper scrutiny, and we specifically listed above strong rebuttals to the closing arguments of each of the sections (which were all included in the debate written material).

Having contradicting strong evidence

Saar brought up an interesting point halfway through the debate: you should almost never see very high Bayes factors on both sides of an argument.

That is, suppose you accept that there’s only a 1-in-10,000 chance that the pandemic starts at a wet market under lab leak. And suppose you accept there’s only a 1-in-10,000 chance that Covid’s furin cleavage site could evolve naturally.

If lab leak is true, then there’s no problem with finding 1-in-10,000 evidence for lab leak, but it’s a freak coincidence that there was 1-in-10,000 evidence for zoonosis (and vice versa if zoonosis is true).

As explained above, even one 10,000x factor is unlikely to be found in the Covid origins question. It is true that when it is possible (controlled environments), then you should definitely not see two opposing ones – that would indicate one of them is not really 10,000x and you did not steelman properly.

Nevertheless, it is possible to reach high confidence when examining multiple pieces of evidence, which is another reason why having good inference is superior to having good evidence. While smoking-gun evidence is hard to come by, reaching smoking-gun levels of confidence is possible through good inference. 

There is something similar in scientific discourse: We are much more impressed by multiple independent studies replicating the same result at a modest p-value than a single one claiming a very strong p-value.

The similarity of zoonosis claims to UFO claims

I’m potentially sympathetic to arguments like Saar’s. Imagine a debate about UFOs. Imaginary-Saar says “UFOs can’t be real, because it doesn’t make sense for aliens to come to Earth, circle around a few fields in Kansas, then leave without providing any other evidence of their existence.” Imaginary-Peter says “John Smith of Topeka saw a UFO at 4:52 PM on 6/12/2010, and everyone agrees he’s an honorable person who wouldn’t lie, so what’s your explanation of that?” Saar says “I don’t know, maybe he was drunk or something?” Peter says “Ha, I’ve hacked his cell phone records and geolocated him to coordinates XYZ, which is a mosque. My analysis finds that he’s there on 99.5% of Islamic holy days, which proves he’s a very religious Muslim. And religious Muslims don’t drink! Your argument is invalid!” On the one hand, imaginary-Peter is very impressive and sure did shoot down Saar’s point. On the other, imaginary-Saar never really claimed to have a great explanation for this particular UFO sighting, and his argument doesn’t depend on it. Instead of debating whether Smith could or couldn’t have been drunk, we need to zoom out and realize that the aliens explanation makes no sense.

This is a parable we like and often use that is actually quite relevant to the zoonosis claim:

All evidence for UFOs is always ‘almost there.’ If only the camera had 3x more zoom, we would finally have a clear UFO photo. If only the building didn’t block the view at the critical moment in the video, if only the abductee had an audio recorder running. 

When you have a lot of evidence that is ‘almost’ conclusive, instead of being an indication for the strength of your hypothesis, it likely indicates the presence of some filter between you and the evidence. In the case of UFOs – when we have good documentation it reveals there is a mundane explanation for the phenomena, which then prevents the evidence from becoming popular.

Therefore, the pattern of the UFO evidence does not support the UFO visits hypothesis, despite the supposed abundance of that evidence.

Zoonosis is similar in that all their evidence is based on complex models using unreliable data, with many single points of failure.

For example, the market cases are all lineage B – simple and robust evidence that it is not the source. Zoonosis proponents respond with a highly complex model that shows that lineage B was the first to jump to humans, and later another animal with a 2-mutation earlier variant happened to reach the same market and infect others, while no other animal infected any other human anywhere in the world. The model claims 98% confidence in this scenario, so zoonotic wins. Later, when major errors are found in the model, researchers are not deterred and come up with another complex model. And indeed, while preparing for the debate, an erratum was published on this lineage model, reducing its significance to negligible, which doesn’t stop proponents of zoonosis to continue to rely on this and other such models as strong evidence. This is a pattern of evidence indicative of motivated reasoning, allowing us to heavily discount such studies.

To be clear, lab leak proponents also have plenty of weak evidence like that, but we do not use it in our analysis, and for the same reason. However, unlike Zoonosis, lab-leak also has good evidence. There is no explanation for the Wuhan outbreak, for why an FCS arose with a very rare mutation type,  why its sequence is from some unknown foreign source, why no animal host was found, why no other spillovers appear anywhere in the world. These are easy to understand claims, that can be statistically quantified, and have few points of failure (which is why no one was able to refute them). Zoonosis has exactly zero such evidence.

This is yet another example of why good inference tools are more important than a full understanding of all the evidence.

Comparing people’s probabilistic analyses

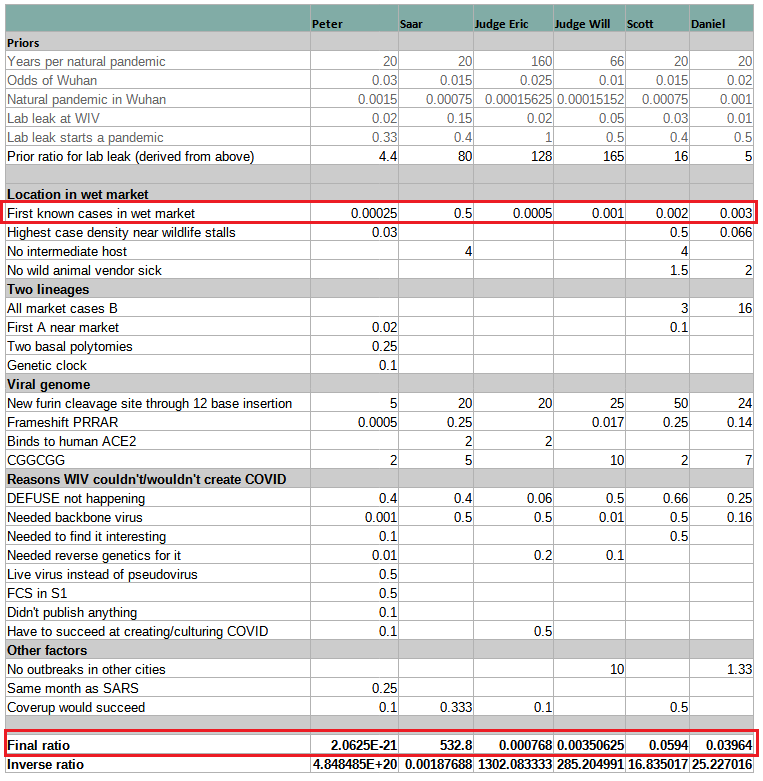
This very helpful table clearly illustrates how the mistake in interpreting HSM is the key to misunderstanding origins. All models assign more extreme probabilities to “First known cases in wet market” than the “Final Ratio” (except for Peter’s whose numbers are given half-jokingly). If you correct that mistake by replacing the wrong number with Rootclaim’s 0.5 and recalculate, everyone turns into supporting lab-leak or being roughly even. Specifically, Scott’s conclusion would change from its current 94% zoonosis to 94% lab-leak, which incidentally is identical to Rootclaim’s conclusion (although that is after our sensitivity analysis). 

The key takeaway from this is that anyone who’s claiming zoonosis is more likely, but is unable to point to any major weakness in our analysis above of why HSM is negligible evidence, can be safely ignored.

The six estimates span twenty-three orders of magnitude. Even if we remove Peter (who’s kind of trolling), the remaining estimates span a range of ~7 OOMs. And even if we remove Saar (limiting the analysis to neutral non-participants), we’re still left with a factor-of-50 difference.

Using this as evidence of the weakness in probabilistic inference is a bit funny. We have 6 estimates that span a very wide range, so obviously this concept doesn’t work. It’s not important that 5 are by people who have never done a full probabilistic inference analysis in their life, and one is by a team doing it for a decade.

Additionally, Rootclaim’s number here is before the sensitivity analysis, which turns the 1:532 (99.8%) into 94%. The sensitivity analysis results in us rarely getting extreme numbers, so our conclusions actually span a fairly narrow range, and are not easily moved by small changes. Therefore, the generic complaint mentioned above does not apply to Rootclaim.

Lab-leak claims debunked?

Peter’s position is that, although the lab leak theory is inherently plausible and didn’t start as pseudoscience, it gradually accreted a community around it with bad epistemic norms. Once lab leak became A Thing – after people became obsessed with getting one over on the experts – they developed dozens of further arguments which ranged from flawed to completely false. Peter spent most of the debate debunking these – Mr. Chen’s supposed 12/8 Covid case, Connor Reed’s supposed 11/25 Covid case, the rumors of WIV researchers falling sick, the 90 early cases supposedly “hidden” in a random paper, etc, etc, etc. Peter compares this to QAnon, where an early “seed” idea created an entire community of people riffing off of it to create more and more bad facts and arguments until they had constructed an entire alternative epistemic edifice.

None of these claims were actually debunked, and anyway, they were either ignored or incidental in Rootclaim’s analysis.

Peter failed to weaken any of Rootclaim’s core evidence, while his only evidence – the HSM early cluster, is shown to be of negligible weight when using proper inference methods.

What will get people to trust Rootclaim?

If Saar wants to convince people, I think he should abandon his debates – which wouldn’t help even if he won, and certainly don’t help when he loses – and train five people who aren’t him in how to do Rootclaim, up to standards where he admits they’re as good at it as he is. Then he should prove that those five people can reliably get the same answers to difficult questions, even when they’re not allowed to compare notes beforehand. That would be compelling evidence!

We don’t think this would be convincing to a wide audience outside people who think like Scott. However, we don’t really have any better ideas, and would love to hear ideas from readers. 

In general, the Rootclaim experience is highly frustrating – we spend years developing a new rigorous mathematical approach to answer important unanswered questions, but no one actually engages with the model itself or points to any flaws in it, but instead respond with standard flawed arguments about some evidence that ‘obviously’ contradicts a specific conclusion, without providing any rigorous explanation why it’s so obvious.

We’d love to hear suggestions for making our methodology more approachable and convincing to a wide audience. Thanks for helping!

Was China covering up zoonosis?

“Conspiracy theory” might be the wrong term here, because we already know there were several conspiracies. There was the conspiracy by the virologists to get the media not to talk about the lab leak. And there was a conspiracy by China to cover up the evidence on both sides. Peter pointed out that China wasn’t just motivated to cover up lab leak; they also covered up a lot of the evidence for zoonotic spillover (although Saar points out this coverup only started later, and doesn’t really affect his case). China’s “theory” is that the Covid pandemic started in Maine, USA, and reached Wuhan via a shipment of infected lobsters (really!). They were happy to be equal-opportunity coverer-uppers, hiding a lot of evidence for any story opposing this one.

This is untrue. They clearly said from the start this is a zoonotic spillover at HSM, and at least part of the government went to immense efforts to identify the animal, close farms, etc. (and of course couldn’t find any infected animal).

Only in late 2020 did they start suspecting an import from cold-chain products after having multiple outbreaks that seem related to cold-chain products. 

Worth noting that it’s actually a reasonable conclusion to reach once you see the evidence goes against an animal spillover in HSM, and you’re incentivized against claiming a lab leak.

New evidence WIV was meant to do more DEFUSE work

Also, a new Freedom of Information Act request got early drafts of the DEFUSE grant proposal with new details, of which the most explosive was a comment by the American half of the team, reassuring the Chinese half that even though the proposal focused on American work to please funders, they would let the Chinese side do some “assays”. Lab leakers say this disproves the argument that, because DEFUSE said the work would be done in the US, the Wuhan Institute of Virology couldn’t/wouldn’t do advanced gain-of-function research.

(I asked Peter his response – he said the original draft of DEFUSE also said that the Chinese side would do “live virus binding assays”, and this isn’t the kind of gain-of-function research necessary to make Covid.)

This is a very narrow interpretation of this bombshell discovery (p. 235 here). Having such a comment on record is a clear indication that the DEFUSE proposal was dishonest about the division of work and they are likely to do more work at WIV, where it would likely be cheaper and require less safety regulations.

Pseudoscience is everywhere

If we don’t accept the judges’ verdict, and think lab leak is true, are we worried the zoonosis side has some misbehavior of its own? Yuri and Saar didn’t talk about that as much. High-status people misbehave in different ways from low-status people; I think the zoonosis side has plenty of things to feel bad about (eg the conspiracies), but pseudoscience probably isn’t the right descriptor.

We indeed don’t make a big deal about unscientific behavior of people who oppose the conclusions we reach. First, because we don’t view ourselves as proponents of those conclusions, but of our methodology, which we realize can sometimes cause a conclusion to change, suddenly placing us on the other side. Second, because our whole process is about overcoming human bias, we are well aware of these human weaknesses, and consider it part of the mechanism. We generally find equally bad reasoning on both sides of each analysis we make – this is just how humans are.

We similarly didn’t make a big deal of the many mistakes we found in Peter’s claims, because we know the number of mistakes doesn’t have any effect on the conclusion – we just evaluate the evidence that does survive scrutiny. Peter dedicated a lot of his time to pointing mistakes in lab-leak claims (which were either claims we didn’t make, were inconsequential to our conclusion, or were not actually mistakes) and in retrospect we realize this created a wrong impression regarding the weight of evidence of each side, and may have also contributed to the loss of the debate. 

It is worth clarifying that the zoonosis side is definitely full of pseudoscientific claims, just like all sides of all hypotheses we ever analyzed. There is basically no evidence for zoonosis other than the results of repeating the following process:

  1. Let’s take unreliable, biased, manipulated data (early case data provided by China, mobile check-in data)
  2. Let’s develop a highly complex model with multiple single points of failure that provides an explanation that is in contradiction to obvious and simple to understand evidence supporting lab-leak (Pekar, Worobey).
  3. Whenever a mistake is found in those complex models either ignore it or correct it while claiming the model still stands, not realizing this is likely just one of many bugs and the whole work should be retracted.
    Worth noting here that during our research for the debate, we alone found probably 10 catastrophic mistakes in these studies.

This may also be a good point to reflect on the full picture as claimed by the zoonosis side and appreciate how weird it is.

  1. A bat coronavirus infects another host.
  2. It circulates there in enough hosts and for a long enough time that it is able to acquire this clean FCS insertion – which nothing remotely close to it was ever seen in any natural virus.
  3. Two of these hosts are brought to HSM, which happens to reside in the same city as WIV, who were involved in plans to build a virus with these exact features. All of this in a city that is nowhere near bat habitats and far from south China where wildlife consumption is popular.
  4. For some reason, the host with the later version of the virus infects people first, and the earlier variant spills later. This claim is necessary because the alternative is to admit that despite lineage A and B being all over Wuhan, somehow only the later lineage B appears in the supposed spillover location.
  5. Other than these two animals that somehow reached the exact same location, no other host is known to infect anyone else. No animal is ever tested positive for ancestral strains. Of the millions of humans sequenced, not one was infected by a virus that is not downstream from Wuhan.

This is certainly not how other pandemics have started.

Compare this to the lab leak story:

  1. WIV did exactly the work they were interested in.
  2. As planned, they did it in BSL-2 without masks, so unsurprisingly, someone got infected.
  3. It spread through Wuhan unnoticed, infecting Reed and whoever infected Chen, later forming an early cluster at HSM, exactly as we later see happen in other cities.

Of the many objections raised to this scenario, only two have not been completely refuted: We’re not yet sure about the engineer’s exact motivations in choosing that specific FCS sequence, and we don’t know whether WIV found a relevant virus in their collection trips.

Scott’s reduction of the HSM 10,000x factor

I started with a 10,000x Bayes factor on the market, but it was extremely lightly considered and not really adjusted for out-of-model error. Based on our discussions, I divided by four based on Saar’s good point that the market represented less than 100% of the possible zoonotic spread opportunity in Wuhan (I cashed this out as it representing 25% of opportunity, though with high error bars). Then I divided by an extra factor of five representing some sort of blind outside view adjustment based on how strongly Saar holds his position (this was kind of also a decision to explicitly include potential outside-the-model error because that would make discussing it with Saar easier).

This little footnote is actually the key to the entire analysis. Correctly assessing this number determines what is the most likely hypothesis, and Scott simply handwaves two numbers without providing any explanation for why they are appropriate. This is in contrast to the Rootclaim model that divides the number into its three components, and uses multiple unbiased sources to calculate each.

The 25% number is equivalent to claiming that nearly all zoonosis spillovers happen in markets with wildlife (since HSM is only one of four such markets in Wuhan, albeit the largest), completely discounting that prior to 2020 scientists pointed to other locations as far more likely, and ignoring that in SARS1 markets were a rare spillover location. Our estimate of 3-5% is far more reliable and well sourced.

He then gives no weight at all to the conditions in HSM, implying an HSM vendor who interacts daily with many people in an unhygienic closed environment that was proven to form early clusters elsewhere, is no different from a random Wuhan resident. Again, our 1% estimate is far superior, as it uses three independent methods, all based on actual data.

The additional 5x factor he gave due to Saar’s strong position is not the best way to approach this. Steelmanning is not about arbitrarily increasing conditional probabilities. It is about truly considering alternative explanations and evaluating the strongest ones. Sometimes it could be 1000x and sometimes nothing. He should examine the actual quantitative arguments made to reach a 2x factor for HSM, and the data they’re based on, see if he can find any weaknesses, and update accordingly. Since there is a 250x difference at play here, this is the most important disagreement to focus on, as it has the most potential to sway the decision. The rest can wait.

Scott’s final number (500x) is based on highly biased estimates which cannot be justified. As shown, once this is corrected, Scott’s conclusion changes from 94% zoonosis to 94% lab-leak.

Rootclaim’s COVID-19 Origins debate results

And the winner of Rootclaim’s COVID-19 origins debate and the $100,000 prize is…

Unfortunately, not us :). We would like to explain this result, but first, we would like to congratulate our opponent and Rootclaim’s first challenger, Peter Miller. Miller showcased an impressive understanding of the details during the debate, which was hard to match.

While Peter’s victory was well earned within the parameters of the debate, we believe it was also due to our failure to structure an effective debate. 

Obviously, one can simply conclude the correct decision was reached and zoonosis is simply the likelier hypothesis. Without resorting to sore losing and given the importance of this issue, regardless of the debate, we would like to explain why we still believe the lab leak hypothesis is the most likely explanation for the origin of COVID-19 and, as our new and updated analysis shows, its likelihood only increased following the deeper analysis we did for the debate. 

First, we’d like to clarify, that the judges did an amazing job, putting immense effort, thought, and talent into their decisions:

  • Will Van Treuren is a microbiologist and immunologist with a PhD from Stanford. He works as Chief Science Officer at a biotech company developing new drugs to treat inflammatory diseases. Will’s written decision can be found here and here and a video summary is available here.

  • Eric Stansifer is an applied mathematician with a PhD in the Earth sciences from MIT. He has previously done research in a mathematical virology research group, doing simulations of MS2 capsid assembly. Eric’s written decision can be found here and a video summary is available here (you can also read his blog here).

What went wrong?

So, if the judges did their job well and our opponent played by the rules, what went wrong? We believe two things tilted the debate in favor of our opponent and we will correct them in future debates: 

First, the debate structure provided a major advantage to the debater with more memorized knowledge of the issue. The debate was live (via video) and Miller exemplified extensive knowledge and superb memory for many details, which we could not compete with in real-time. This was not an issue in the second session about genetics, where we were represented by Yuri Deigin, but our second mistake (below) made his good efforts irrelevant. While such superiority is worthy of victory in normal debates, Rootclaim strives to create a model for reasoning and inference that minimizes the problems with human reasoning. Unfortunately, we structured a debate that rewards it. To fix this, future debates will be held in an offline text format, with only a short video presentation at the end.

The second issue we identified was that we failed to incorporate a process of ongoing feedback from the judges, spending most of our time on issues that had little impact on the final decision. In their ruling, we found major mistakes in their understanding of our analysis, which could have been easily corrected had we built the debate with more direct ongoing feedback from the judges. 

For example, we know from years of dealing with probabilistic inference that it is highly unintuitive, and it is a challenge to translate to human language. We therefore focused more on an intuitive understanding of the evidence, with probabilistic inference used only as a background framework.

In practice, we were surprised to see both judges found probabilistic inference to be the best way to reach a decision. We of course agree, but had we known this to be the case, we would’ve focused our efforts on explaining how to do probabilistic inference correctly, describing the major pitfalls we discovered over the years, and how to avoid them. As we failed to do so, errors in the judges’ probabilistic inference resulted in unrealistic numbers assigned to the evidence. 

The mistakes were heavily skewed toward zoonosis, since our methodology involves steelmanning and maximizing the likelihoods of both hypotheses, while Miller used figures heavily biased toward zoonosis, in some cases using extreme estimates that are impossible to reach in a robust probabilistic analysis, as we explain below.

The Risks of Strawmanning

This mistake of assigning extreme numbers is similar to strawmanning in human debate, and can demolish an otherwise valid probabilistic analysis. Following is a semi-formal definition of the problem and how to avoid it:

  1. Our goal in a probabilistic analysis is to estimate Bayes factors.
  2. A Bayes factor is the ratio of conditional probabilities.
  3. A conditional probability p(E|H) is the probability the evidence E will occur, assuming H is true.
  4. In real-world situations, there are many ways E can occur, so p(E|H) should integrate over all those ways (using “1−∏(1−pi)”).
  5. In practice, focusing only on the most common way is usually accurate enough, and dramatically reduces the required work, as real world data tends to have extreme distributions, such as a power law distribution. 
  6. This is the “best explanation” – the explanation that maximizes the likelihood of the hypothesis – and making a serious effort to find it is steelmanning. 
  7. A mistake in this step, even just choosing the 2nd best explanation, could easily result in orders-of-magnitude errors.
  8. To reduce such mistakes, it is crucial to seriously meet the requirement above of “assuming H is true”. That is a very unintuitive process, as humans tend to feel only one hypothesis is true at any time. Rational thinkers are open to replacing their hypothesis in the face of evidence, but constantly switching between hypotheses is difficult.
  9. The example we like to give for choosing a best explanation is in DNA evidence. A prosecutor shows the court a statistical analysis of which DNA markers matched the defendant and their prevalence, arriving at a 1E-9 probability they would all match a random person, implying a Bayes factor near 1E9 for guilty.
    But if we try to estimate p(DNA|~guilty) by truly assuming innocence, it is immediately evident how ridiculous it is to claim only 1 out of a billion innocent suspects will have a DNA match to the crime scene. There are obviously far better explanations like a lab mistake, framing, an object of the suspect being brought by someone to the scene, etc. The goal is to truly seek which explanation is most likely for each hypothesis, using the specifics of each case.
  10. Furthermore, it’s important to not only find the best explanation but honestly think about how well we understand the issue and estimate how likely it is there is some best explanation that still evades us (i.e. that we are currently estimating the 2nd best explanation or worse). This too is obvious to researchers who know not to go publish immediately upon finding something, but rather go through rigorous verification that their finding doesn’t have some other mundane explanation.
  11. So, the more complex the issue is, and the weaker our understanding of it, the less justified we are in claiming a low conditional probability. In frequentist terms, the question we should ask ourselves: How often did I face a similar issue only to later find there was a much more mundane explanation? Suppose it’s 1 in 10, then the lower bound on our p is 0.1 times however frequent that mundane explanation happens (say 0.2, for a total of 0.02)
    Claiming something like p=0.0001 in a situation where we don’t have a perfect understanding of the situation is a catastrophic mistake.
  12. For well-designed replicated physics experiments p could reach very low (allowing for the five sigma standard), but when dealing with noisy complex systems involving biology, human behavior, exponential growth, etc. it is extremely hard to confidently claim that all confounders (i.e. better explanations for the finding) were eliminated, so claiming a very low p is an obvious mistake.
  13. The last guideline is to also examine our confidence in our process. As we examine best explanations, we also need to account for the possibility that we made mistakes in that process itself.
    Suppose the explanations for the DNA match are only “by chance” and “lab mix-up”, and suppose we examined the lab procedures and talked to staff and determined a mix-up was very unlikely, it still doesn’t make “by chance” the most likely explanation, since it is still possible our analysis was wrong, and the combined probability of our mistake and a mix-up (say 0.01*0.01) is still much higher than a chance match (1E-9).

To summarize: Estimating the Bayes factor requires estimating conditional probabilities, which requires finding the best explanation under each hypothesis, which can easily succumb to several pitfalls that cause catastrophic errors. To avoid those: a) Seek and honestly evaluate best explanations under the assumption the hypothesis is true, b) Estimate the likelihood that there is some better explanation that is yet to be found – the more complex the issue is, the higher the likelihood, and c) Estimate the likelihood of mistakes in the estimates themselves.

The Main Mistakes

We therefore never provided extremely low conditional probabilities under zoonosis, and as a result didn’t have any extreme factors in our analysis. Unfortunately, the result of our steelmanning was that when our hypothesis’ explanation was favored, the effect on the final likelihood was much smaller than when Miller’s was. When the judges did not have the tools to conclude between the sides, their result was some average of the two, which of course, given the extreme, strawmanned numbers offered by Peter, favored zoonosis.

Again, to clarify, this is no fault of the judges and is fully our responsibility for structuring the debate incorrectly. We found many such mistakes throughout both judges’ decisions, but in the interest of time would like to focus on the three most important ones that are enough to make lab-leak far more likely, once corrected.

Mistake #1: p=0.0001 for an HSM early cluster

The first mistake in the judges’ decision was accepting an extremely low likelihood for the Huanan Seafood Market (HSM) to form an early cluster of infected patients if Covid originated in a lab. Now that we’ve demonstrated the importance of steelmanning, it’s obvious that it is a mistake to consider HSM to be a random location in Wuhan (i.e. will form an early cluster only once every 10,000 hypothetical SARS2 lab leaks in Wuhan).

Even though we were not able to provide a perfect model for why HSM is a likely early cluster location, the complexity of a virus spreading in an urban area, and especially the huge difference that a small exponential advantage at HSM will have on the final numbers, means there is no way to reach anywhere close to the level of confidence required to claim a number as extreme as p=0.0001.

Mistake #2: p(Lab leak)<0.01 in priors

The second major mistake in the judges’ decision, again involves using extremely low likelihood instead of steelmanning, this time in the prior likelihood for a lab leak. Each judge made different mistakes, but both reached numbers that, unknowingly to them, imply gain-of-function research is extremely safe, and all the expert warnings and government moratoriums on it were wrong – a level of confidence that is of course impossible to reach without making some outstanding breakthrough in the understanding of the field. See more details here:

Stansifer’s mistakes:

  • Severe underestimate (0.02) of the probability that at least one researcher in WIV will undertake a project that WIV clearly expressed interest in. The mistake here seems to come from wrongly thinking SARS2 has features that are not covered by DEFUSE. Interestingly, after Stansifer reached his decision, it was discovered that WIV was planned to do a lot more than officially written in DEFUSE.
  • Severe underestimate (0.02) of the probability that a researcher working on a SARS2-like virus for weeks or months under BSL-2 would get infected. There is good reason to claim this could be an over 50% probability, and we gave it a conservative 15%, but 2% is highly overconfident.
  • These two mistakes imply the probability of any work in the Wuhan’s Institute of Virology (WIV) causing a leak to be 1 in 17,000 years. Given that WIV was planning to do coronavirus GoF experiments under BSL-2 – meaning they’ll be dealing with a respiratory virus without even a face mask, this could easily be a 100x mistake.

Treuren’s Mistake:

  • A redundant 0.01 factor was added for requiring WIV to have an unpublished backbone with 98% nucleotide similarity to SARS2. There is no such need. Since our prior was defined as a novel coronavirus pandemic, then all we need to estimate is the probability that a virus capable of that existed in WIV. Specifically, since DEFUSE describes searching for hACE2 matches and adding FCS, then the only question is whether WIV held a virus with a good hACE2 match.

    We know BANAL-52 is identical in the RBD to SARS2, so if a relative of it was collected then they have a backbone and we’re done. But we should expand that to any virus with an hACE2 match, even one with 80% similarity to SARS2, so it’s very reasonable that at least one will be found. We gave this 50%.

    Another way to look at this mistake: If we arbitrarily limit the engineered backbone to have 98% similarity to SARS2, we should apply the same limitation to the zoonotic progenitor, meaning we should discard from the prior any pandemic that is caused by viruses that doesn’t use hACE2, or those with good hACE2 match but using a different genetic sequence.
    If we place this requirement on both hypotheses, the effect cancels out.

Mistake #3: Missing that the FCS estimate is heavily steelmanned

The third major mistake in the judges’ decision, was using a low estimate for the likelihood of the Furin Cleavage Site (FCS) occurring naturally. A naive analysis of the combination of the rare occurrences behind the FCS insertion (which you can read about in our thread here) places us comfortably in a Bayes factor of millions. Ironically, had we just submitted this strawmanned calculation, we could have won the debate. However, since our goal was to actually determine what hypothesis is most likely, we steelmaned this estimate as well, thinking of the most likely way this could happen, truly assuming zoonosis is true.

Conclusion

As explained, we have updated our debate structure to avoid these problems in the future. Rootclaim’s $100,000 challenge is still open to anyone, including on the COVID-19 origins issue, as we’re still standing behind our analysis and willing to put our money where our mouth is. 

We have invited Peter to reapply, using the updated textual debate format with ongoing judge feedback, allowing the sides to fully convey their hypothesis in exactly the problematic areas. Miller has declined a rematch but we respect his decision to move on and invite others to take his place. 

The idea behind our challenge and risking money is to provide a strong incentive for deep research and analysis. This was successful beyond our expectations with Miller now probably one of the people with the deepest and most encompassing knowledge about the origins of COVID-19.

In ‘A Journey to the Center of the Earth’, Jules Verne wrote that “Science is made up of mistakes, but they are mistakes which it is useful to make because they lead little by little to the truth”. You don’t go into the probabilistic inference business expecting certainty and In this spirit, we appreciate this loss as our compass to future success. 

Rootclaim accepts $500,000 challenge on COVID vaccine safety & efficacy

Have mRNA vaccines killed more people than they have saved?

That’s what American entrepreneur Steve Kirsch claims in his list of Covid-19 challenges. Today, Rootclaim has officially accepted his challenge in the amount of $500,000.

After reviewing all challenges we decided to accept challenge no. 6: “The Pfizer and Moderna mRNA vaccines have killed more people than they have saved from dying from COVID“. This addresses two of the most pressing and hotly debated issues of the pandemic: vaccine efficacy and vaccine safety. Advancing public discourse on these issues will likely save lives, and improve preparedness for future pandemics. 

After analyzing the available evidence, we conclude that despite several shortcomings, mRNA vaccines have saved many more lives than they cost.

While we challenge Kirsch on this specific item, we actually agree with a number of his other claims, including some that run counter to mainstream opinion. As Kirsch pointed out in his post, we agree with item 9 (“Lab origin is more likely”) and even offer our own challenge on the subject. Before examining vaccines, we studied the benefit of masks (items 7 and 10 in Kirsch’s list) and were surprised to find it is far from clear they are indeed effective, given the many factors involved in their practical use, such as most people wearing them poorly, virus transmission through the eyes, virus adaptation, and considerations of herd immunity. We are also generally in agreement on the importance of drug repurposing in COVID (related to challenge no. 8).

We have great admiration for Kirsch’s willingness to take a personal risk on his public claims. This is in sharp contrast to the many public figures constantly making overconfident statements on matters of great importance, without taking any risk. This is something we repeatedly encounter in our work. Some examples:

These examples demonstrate the low value of claims made when nothing is at risk: public discourse is awash with baseless, overconfident claims that carry no repercussions for their claimants if they turn out to be false. We believe that adding ‘skin in the game’ can dramatically reduce this problem, and therefore offer our own public debate challenge, which coincidentally happened to be very similar to Kirsch’s. So far no one has applied.

We therefore greatly appreciate Kirsch’s courage and leadership here. We see it as our responsibility to accept a challenge when we think the claim is wrong, and of course, take the loss if we fail.

It should be emphasized that regardless of who wins in this particular case, this is a victory for public discourse. First, by offering a reliable resolution to the important question of vaccine efficacy and safety, and more importantly, by setting a standard for settling controversies: an impartial, judged debate where both sides take a significant risk on the outcome. Hopefully, in the future, people making confident assertions on issues of importance without taking a risk will be ignored as background noise.

Update: As we were applying, we noticed Kirsch has recently added a note to his challenge page, terminating the bets due to no one applying. Since we were already in private discussions with Kirsch on the terms before this update, we would be very surprised to find this would apply to us. 

Update #2: We and Kirsch are making good progress on setting the parameters of the $500,000 challenge and we’re in the process of finalizing our agreed picks for two judges. Our preference will be for the most experienced, well-respected, and unbiased experts. 

Repurposing drugs to end COVID-19

The Problem

As the pandemic seemingly becomes endemic, two new, purpose-built drugs have just been FDA-approved. Pharmaceutical companies have been busy perfecting these new treatments,  paxlovid and molnupiravir, almost since the pandemic began. The approval and roll-out of vaccines similarly took the better part of a year, on an expedited process no less. But the COVID-19 vaccines were an outlier, usually developing these purpose-built treatments takes years and can cost billions.

But waiting two years is too late. In a pandemic, a rapid response is paramount. Waiting for an effective, low-risk, purpose-built treatment that may only come in years will lead to innumerable deaths in the meantime, as happened during COVID-19.

So, under the constraints of a pandemic, the best way to save lives is to save time. Repurposing mobilizes already existing drugs with a known safety profile into the fight against the pandemic. Limiting ourselves to new drugs when a wealth of potential candidates already exists is extremely harmful. But repurposing does more than just provide a more efficient use of resources: deploying multiple drugs simultaneously limits opportunities for the virus to adapt as opposed to introducing each drug gradually. 

The immediate question, then, is how to identify promising candidates and how to get them widely adopted. There are currently around 20 candidates for repurposing to combat COVID-19. Working out which are the most effective, and recommending them to the public, could end the COVID-19 pandemic.

Those who have read our ivermectin blog post will be familiar with the major stumbling block: no one in industry currently has the incentive to conduct repurposing trials and no one in government has the right combination of access to data and decision-making capacity to pursue a drug repurposing policy. 

Existing Evidence

Despite the lack of incentives, some researchers did manage to conduct trials into drug repurposing for COVID-19. They had to run on shoe-string budgets, resulting in imperfect, flawed results. However, the resulting data is not useless, and careful analysis of all trial data can signal which repurposed drugs are likely enough to work.

There are around twenty candidates which have been discussed or trialled, including: vitamin Dfluvoxamine, antiandrogens, arginine, famotidine, melatonin, quercetin, vitamin K2, CoQ10, various mouthwashes and nasal sprays, nigella sativa and zinc lozenges. All have supporting studies, a strong biological rationale, or demonstrated effectiveness against similar viruses.

Of these, we find four to be the most promising as they have multiple independent sources signalling efficacy. This reduces the possibility of being wrong by only relying on one source, which may turn out to be false, either as a result of fraud, study flaws, or confounding factors. We estimate each treatment has over an 80% likelihood of being very effective, and they all carry near-zero risks. A protocol combining all of them is near certain to be highly effective, and may even end the pandemic.

Examples of signals of efficacy are: randomized controlled trials (RCT), a plausible mechanism of action, and a correlation between the use of the drug and COVID-19 severity. Especially interesting is a study on electronic health records (EHR) from Clalit health services (the largest health provider in Israel), which examined which purchases made in pharmacies were later associated with reduced severity. Only 41 drugs were found to be significantly protective, out of over 1000 examined, including all treatments below. 

Fluvoxamine

Plausible mechanism of action:

  • Fluvoxamine is a selective serotonin reuptake inhibitor (SSRI) antidepressant, hypothesized to have multiple mechanisms of action including an anti-inflammatory effect as an agonist for the sigma-1 receptor, reducing platelet aggregation, decreasing mast cell degranulation, and more. 

Correlation studies

  • In the Clalit study, patients purchasing escitalopram (another SSRI) were 17% less likely to later be hospitalized.

Randomized control trials

  • An RCT found fluvoxamine to reduce hospital admissions by 35% and possibly cut deaths dramatically (1 versus 12 among those adhering to protocol).
    Unlike other repurposing trials, this was a large-scale high-quality study, which received unanimous support from experts.
  • As fluvoxamine was already considered a promising candidate prior to this trial, this success validates the whole model, indicating there are many more effective treatments that are currently overlooked.

Vitamin D

Plausible mechanism of action:

  • Vitamin D is an essential hormone of the immune system, and our modern indoor lifestyle causes many to be deficient in it. It is reasonable to assume that these deficiencies result in a suboptimal immune response to COVID-19.  
  • Additionally, it can promote autophagy, the process of replacing older cells with newer ones which can help fight infections better.  

Correlation studies

  • Prior to COVID, a meta-analysis of 25 RCTs found vitamin D supplementation to be protective against respiratory tract infections, especially among those deficient in it.  
  • In the Clalit study, patients buying vitamin D were 9-11% less likely to later be hospitalized. 

Randomized control trials

  • An RCT of 76 patients in Spain found that calcifediol (a more active form of vitamin D) dramatically reduced ICU admission and mortality. Of the 50 patients treated with calcifediol, 1 required an ICU  compared with 13 of the 26 patients in the control group (a risk ratio of x25!). The trial had significant flaws but they are likely not enough to explain such a strong result.

Oral, ocular, and nasal disinfection

Plausible mechanism of action

  • Virus replication is believed to start in these locations, and since they are regularly exposed to the outside world, they are able to survive disinfectants that would be too damaging in internal use. Regular disinfection of these areas is hypothesized to neutralize the virus before it expands into other organs and becomes uncontrollable.

Correlation studies:

  • Impressively, 7 out of the 41 drugs identified in the Clalit study are related to eye hygiene. 

Randomized control trials

  • 10 RCTs have so far been published testing the disinfectant povidone-iodine. Assessed together, they show an overall improvement in symptoms at all stages of infection but are most effective when administered early (81% improvement). 
  • One RCT found that using iota-carrageenan nasal spray as prophylaxis reduced symptomatic cases by 80%.
  • Most notably, one study tested simultaneous disinfection of the mouth, nose, and eyes, with povidone-iodine and showed an astounding 27-fold drop in patients who remained COVID positive after a week (70% vs 2.6%). 

Antiandrogens

Plausible mechanism of action

Correlation studies

  • Males are known to suffer from more severe COVID-19 outcomes.
  • In the Clalit study, patients purchasing the antiandrogen dutasteride were 38% less likely to later be hospitalized.

Randomized control trials

Rootclaim’s Proposal 

We propose the establishment of an independent commission composed of medical and scientific experts with the remit to:

  • Collect all research on repurposed drugs and contact researchers for clarifications. 
  • Determine the weaknesses and reliability of each study.
  • Estimate the probability of efficacy of various repurposed treatments, considering different indicators of efficacy such as their mechanism of action, observational studies, and controlled trials. 
  • Assess the risks and interactions of each, relying on decades of real-world experience.
  • Build protocols of repurposed treatments that best balance risks and benefits. Different protocols should be built, based on patient profiles and disease stages.

These recommendations should form the backbone for a two-front lobbying campaign to convince decision-makers and encourage public adoption.

For decision-makers:

  • Lobby for adoption by public health authorities.
  • Lobby decision-makers and politicians to support the initiative publicly.

For public and doctors:

  • Familiarize doctors and nurses with the late-stage disease protocol.
  • Familiarize GPs and family doctors with the early stage and preventative protocols.
  • Public information campaigns to promote the initiative and reduce scepticism.

At surface level, our proposal seems fairly trivial: use the drugs we already have at our disposal, instead of focusing on developing new ones months or years down the line. Unfortunately, and with catastrophic consequences, implementing this obvious option is extremely difficult within the current incentive structure. But make no mistake – this is the most promising path out of the pandemic.

Ivermectin: both sides are wrong

Do you think ivermectin cures COVID-19? Think carefully: in the age of culture wars, your answer defines your politics. If you think ivermectin is useful, you are an anti-vaxxer, Trump-supporting libertarian; If you think it isn’t, you are a godless, big-government cosmopolitan. Sorry, we don’t make the rules. 

Fine, but still, who is right? The truth is it’s still too early to say. The sorts of bold claims both sides are making are simply premature. The results of the TOGETHER Trial and the flaws recently detected in other trials weaken ivermectin’s case. On the other hand, one trial, that seems to have been well-conducted, points to it being mildly effective if taken at the onset of infection. Overall judgement? it may be useless, or it may be effective under certain circumstances.

But fixating on who is right misses the forest for the trees. Each side blames the other for Covid-19 deaths because of their supposedly wrong answer to this question. But, as it turns out, both sides are promoting deadly policies. 

The damage ivermectin’s die-hard supporters cause is plain to see. Dubbing it a “miracle cure” provides false confidence to the masses to disregard other effective measures. The damage caused by the other side is more insidious, but likely just as lethal. Let us explain why: when dealing with safe, cheap drugs even a moderate probability that they work is reason enough to recommend them. Sure, you may later discover some of the treatments weren’t effective, as may have happened with ivermectin, but that’s negligible compared to the damage of waiting and then discovering some treatments were effective all along.

When experts focus on a study’s flaws, discarding any merit it may otherwise have, what the public hears is: ignore this, vaccines are your only possible hope. 

The only way we’ll get out of this quagmire is probabilistic reasoning coupled with a cost-benefit analysis.

The best demonstration of this is in the FLCCC treatment protocol, which recommends a range of low-risk, potentially-useful repurposed drugs. While the TOGETHER trial showed that their ivermectin recommendation may have been ineffective, it also showed that Fluvoxamine, another drug in their protocol, reduced hospitalizations by 35%, and possibly cuts deaths dramatically (1 death vs 12 among those adhering to the protocol). Similarly, the FLCCC protocol recommended corticosteroids months before those became the standard of care. It is fair to assume that in the future more treatments in their protocol will be discovered to be effective.

So, regardless of the harmful, overconfident statements made by the FLCCC, doctors following their protocol saved lives, and the conservative, supposedly responsible, approach of their detractors has caused millions of deaths. 

So what went wrong?

In a word: incentives. The market is not incentivized to conduct the kind of large, costly clinical trials needed for high confidence results, when the treatment is a repurposed drug that costs a few dollars per patient. 

When the free market fails, the government should step in; after all, it has a massive public health incentive to find cheap, safe, and effective treatments. The trouble is that there is no single person within the government who has the authority, knowledge, and incentive to make the sorts of cost-benefit or probabilistic analyses needed in a pandemic. Authority-wielding politicians are not experts in health, statistics, or probability, and the few knowledge-wielding bureaucrats with the necessary expertise are mostly incentivized to not make mistakes, and don’t really care if one type of mistake exacts a far higher cost on society than the other. No one is at the helm.

Recommending a low-risk treatment that turns out to be ineffective wastes a modest amount of resources. Delaying a treatment that turns out to be effective may easily kill on a mass scale. But this gross asymmetry in results is not manifested in the decision-maker’s incentives.

So, they inevitably take the safe route of recommending we wait for more information and better quality trials. No one is ever blamed for such a “levelheaded” decision. But in a pandemic, there are no neutral options for decision makers.

This happens time and again. Our analysis of vitamin D is that it is likely highly effective at combating COVID-19. Given its low risk, it should be a top priority for health authorities to ensure no patient is left fighting the disease while being deficient in this essential hormone of the immune system. 

Meanwhile, the US National Institute of Health flounders, proclaiming that “There is insufficient evidence to recommend either for or against the use of vitamin D for the prevention or treatment of COVID-19”. But what is the risk in recommending it, exactly? 

The approach taken by both sides is lethal. Both need to change. 

To ivermectin’s supporters and the FLCCC:  we advise you to stop making overconfident claims on specific drugs. Bold claims such as these may cause people to ignore other effective treatments and they stake all the credibility of a balanced, probabilistic approach on one drug. If that drug turns out to be ineffective, the whole project is undermined. Instead, focus on the strong benefit of a protocol that uses multiple, promising low-risk drugs. 

To the skeptics: finding flaws in clinical trials is important and necessary work. But it’s more important to help fix the system so that conducting high quality trials on cheap, repurposed treatments becomes highly profitable. And in the meantime, remember not every flaw means a trial is useless. Help identify promising signals within imperfect trials that indicate the probable efficacy of low-risk treatments, and push for their immediate adoption, so the Fluvoxamine disaster is not repeated. 

The ever-present culture war around who is right and the rigid approach maintained by each side is killing people. Please stop. 


New evidence resolves the controversy surrounding the 2013 Syria sarin attack

Since its founding, Rootclaim has tried to bring clarity to areas of uncertainty surrounding world events. Today we are one step closer to that goal, with new discoveries that effectively resolve the major controversy of who was behind the 2013 chemical attack near Damascus.

Responsibility for the 2013 chemical attack has been a hotly contested, politically divisive issue, with a wide consensus in the West that the Syrian government was to blame, while Syria and its allies claimed that it was a “false flag” opposition attack, intended to bring about US intervention.

Rootclaim’s 2017 analysis went against this Western consensus, calculating an 87% likelihood that the Syrian opposition carried out the attack. Following the discoveries discussed below, this has now been updated to 96%, one of our most certain conclusions. Read our updated probabilistic analysis here, including a summary of the main claims of each side.

The new findings are a result of what we believe to be the most impressive independent open-source investigation in history. It was initiated nearly a year ago by several volunteers who reviewed all the evidence from the attack and managed to uncover incontrovertible evidence implicating an opposition faction, confirming Rootclaim’s conclusion.  The full report is available here, and following is a summary of its findings. 

Rocket trajectories

The investigation began by examining the many videos of rocket impact sites that were uploaded following the attack. Each video was examined for clues pointing to its exact location and the trajectory of the incoming rocket.

For example, in this video, the chemical rocket penetrated a wall on a roof and continued to the floor below. Several landmarks in the background can be matched to satellite photos, identifying the exact location (33.519130°, 36.354841°).

Stitching together a few shots from the video shows that the rocket first hit the far wall and then the floor below. Connecting the two impacts provides an estimated trajectory for the rocket, with a launch location to the northwest.

This location is especially interesting as it singlehandedly invalidates the current hypothesis for government involvement in the attack. 

Originally, the common claim was that the attack originated in a Syrian army base. But when the rockets were discovered to have a short range of around 2 km, this claim had to be retracted, as no bases were within that range. 

This prompted Eliot Higgins of Bellingcat, an investigative journalism website that specializes in open-source intelligence, to look for new possible launch locations. In Higgins’ diagram below, the green area is under government control, and the red circles are 2 km from the impact sites (2.1-2.3 km is considered the maximum range). Consequently, he suggested that the Syrian army launched the chemical rockets from the area south of the Air Force Intelligence Branch (yellow rectangle). 

However, this entire area lies east of the blue line we added to the diagram, which shows it could not have been the source, as a rocket shot from there would have penetrated the northern wall of the building rather than the western wall, as seen in the video.

This next video was also reexamined. Its location was identified in 2013 (33.520415°, 36.356117°), and the rocket’s trajectory is clearly evident, since it lodged in the ground without bending, pointing to its source.

In two shots from the video the camera is almost directly behind the rocket, and it is seen to align with a tree and buildings in the background.

Connecting these features in satellite imagery provides the trajectory’s azimuth (towards the yellow building).

Interestingly, the UN misreported this angle by 30(!) degrees (towards the purple building below). 

The UN also misreported another trajectory, both of which conveniently intersected at a Syrian army base (which we now know is 5 times beyond the rockets’ range).  Subsequently, the New York Times printed these mistaken findings on their front page as “forensic” evidence for Syrian army culpability.

Side note: Misuse of power

A similar failure occurred in the OPCW investigation of the 2018 Douma chemical attack, where OPCW personnel who pointed out evidence that the attack was staged were silenced

This hijacking of international bodies by political and financial interests is becoming a major world threat, hurting the lives of millions. Additional examples exposed in other Rootclaim analyses include the failure of health organizations to realize the efficacy of vitamin D (and other unpatented treatments) in treating Covid-19, and when the scientific community and the WHO suppressed evidence supporting the hypothesis that Covid-19 resulted from a lab leak (see our analysis).

Impact sites

The open-source investigation repeated the process above for seven impact sites, producing this map of all trajectories (triangles represent uncertainty of a trajectory).

The agreement between the trajectories is remarkable, with all of them converging on a small area that also happens to be at the expected ~2 km range from the impact sites.

It is widely recognized that this location was under opposition control at the time (the significance of this spot was not known until now, so both political sides had no problem agreeing who controls it…).

Right in the middle of the identified area is this small field with enough space from which to launch rockets, whose importance will soon become evident.

Video of the chemical attack

A month after the attack, when the US threat to attack Syria had already been removed, a video surfaced, which was claimed to have been found on the bodies of “Syrian terrorists”. The video shows Islamist fighters in gas masks launching the exact same rockets, identifying themselves as Liwa al-Islam (the dominant opposition faction in the area), and announcing the date as August 21st 2013 (the day of the attack). 

The existence of video evidence of opposition fighters carrying out the chemical attack is a remarkable story all by itself. What would normally be considered the highest level of evidence, was here dismissed out-of-hand as fake and wasn’t even mentioned in mainstream media, while overconfident unfounded accusations by the US government and false evidence reported by the UN made headlines.

The Rootclaim method prevents this bias by requiring a thorough investigation of all evidence, without filtering. We carefully examined those videos years ago, and also researched video fabrications in general. We found staged videos to be very rare, and that this video has multiple features that are highly uncharacteristic of a fabrication. This finding was a major factor in our initial conclusion.

Thanks to this new investigation, we now have a much deeper understanding of these videos.

The videos are fairly dark with little detail, but a frame-by-frame examination managed to uncover many features of the launch spot, and they perfectly match that same field where all the rocket trajectories intersect.

For example, in several frames the rocket illuminates the area, exposing details such as trees in the background, a field with low vegetation, and a paved platform where the cameraman stands.

In another shot we see a ditch or edge, while other shots show a few scattered trees and brush.

Other such shots in the video provided further features, which were all modeled in 3D, creating a unified view of the area:

This is a perfect match to our field:

Conclusions

We have a video showing opposition fighters with gas masks launching the rockets used in the chemical attack on the night of the attack. This video strongly matches the characteristics of a small field that lies right at the intersection of seven trajectories calculated from the impact sites, within rocket range of all of them.

Continuing to support the government attack hypothesis in light of this new evidence would require constructing a very unusual scenario. Nevertheless, given the political interests surrounding this issue, we will likely witness such attempts soon.

This breakthrough demonstrates the superiority of Rootclaim’s method, which was able to reach this conclusion years ago, without using the new findings, and with much less information and resources than the Western intelligence agencies who confidently claimed the opposite. That is the strength of probabilistic inference: its ability to extract better insights from less evidence.

Of course, many others also took this position, and have now been proven right, but their position was often politically influenced, causing them to reach the wrong conclusion in cases where the West’s claims happened to be true, such as the downing of flight MH17 over Ukraine (we at Rootclaim concluded that it was downed by the pro-Russian DNR, agreeing with the prevailing narrative in the West).

It is very rare to be consistently correct on contentious issues, when each time the truth supports a different political side. We believe Rootclaim is unique in its consistent success in that aspect. 

To summarize the key takeaways from these new discoveries:

  1. Having superior inference methods is far more important than gathering more evidence.
  2. Sometimes, a “smoking gun” is already available, and there is no need to collect more evidence (the information here was all available in 2013). This is especially true for videos and photos, which are so rich in information that there is nearly always another discovery to be made.
  3. The current crisis regarding the public’s trust in authorities and experts is not just about ‘fake news’. Experts are repeatedly failing to serve public interests, due to failures of human reasoning and heavy politicization.
  4. Our society needs to quickly improve its inference methods and especially how our intelligence agencies, courts, international bodies, NGOs, and media operate. The current state of affairs is dramatically increasing the probability of a global catastrophe.

Rootclaim will continue to contribute its part in furthering these goals, by continuing to improve our methodology and by disseminating our analyses to a wider audience.

Promoting Rootclaim is quite a difficult task, when practically every person finds at least one of our findings deeply offensive. But we’re in it for the long run, and will continue to work to consistently provide highly accurate, unbiased analysis of major world events.

Many thanks to the researchers who uncovered these new findings: Michael Kobs, Chris Kabusk, Adam Larson, and many others.

Rootclaim shifts to agile, simplified analyses

We’re proud to announce some exciting updates to Rootclaim. Since its inception, Rootclaim has focused on exposing the truth on many issues in public discourse using probabilistic inference. Rootclaim has established an outstanding track record, using proven mathematical models and publicly available information to overcome the flaws of human reasoning. However, this time consuming approach limited us to being able to respond to relatively few events.   

We are glad to announce upgrades to Rootclaim that will deliver more agile, simplified, and timely analyses.

Previously, much of the analysis work had gone into the tricky effort of identifying and dealing with evidence dependencies. Going forward, we will group dependent evidence and analyze them jointly. This will allow Rootclaim and the readers to examine the evidence in the context of the investigation that exposed it, easily evaluate interdependencies, and assess the significance of missing evidence. Likewise, previously, a large portion of the effort had gone into the analysis of minor pieces of evidence, which have little effect on the calculated results. When analyzed as a group, minor details often lose their relevance.

These new efficiencies will allow us to publish analyses and provide the most reliable estimates about developing stories within a few days instead of the weeks of work that have been previously required.

The new analyses will be more readable while still maintaining Rootclaim’s high level of accuracy, and they can be read from top to bottom without knowledge of probability theory. Each group of evidence and its effects on the likelihood of the hypotheses will be clearly explained. 

We have republished the following two analyses using the new model:

  1. Who carried out the chemical attack in Ghouta on August 21, 2013, reiterating the unpopular finding that the Syrian government did not order the attack.
  2. What caused the disappearance of Malaysia Airlines flight 370, confirming that the pilot likely committed suicide. 

We are also working hard analyzing the 2020 election results for indications of fraud, and will soon publish our analysis on how the COVID-19 pandemic started, with some surprising results…

We invite you to keep following us on social media (and invite your friends!) for updates on new stories, and ask for your help reviewing our analyses and contributing your inputs.

$100,000 Debate Challenge: Chemical Attack in Syria

Among the many atrocities of the Syrian Civil War, the one that stood out was the use of chemical weapons, and particularly the nerve agent sarin. 

While there is general agreement that there were multiple sarin attacks, most of the Western population has accepted that the attacks were carried out by the Syrian government. This assumption is so entrenched that objections to it are widely considered to be “conspiracy theories”.

Rootclaim, however, examined the evidence using a probabilistic analysis, and the calculated conclusion revealed that it is much more likely that opposition forces were at fault

Most of Rootclaim’s conclusions on other issues later became the consensus opinion, despite some initial pushback. Since this has yet to happen with regard to the sarin attacks in Syria, we decided to issue an open $20,000 challenge to debate anyone on this matter. This challenge has gone unanswered since April 2018, and we are now presenting it here in more detail, and increasing the bounty to $100,000. By doing so we hope to demonstrate the superiority of reasoning methods that integrate honest consideration of multiple hypotheses, unbiased analysis of evidence, and probabilistic inference.

Update: In June 2021, a video of opposition fighters launching rockets was matched to a field within opposition controlled territory, and that field has been shown to be at the intersection of seven rocket trajectories calculated from images of the impact sites. With this additional evidence we now consider the issue closed, demonstrating again the superiority of Rootclaim’s methods. While the $100,000 challenge is still available, we don’t expect anyone to apply. 

The challenge

Win a debate with a Rootclaim team member about the sarin attacks in Syria and take home $100,000. See our Rootclaim Challenge page for additional topics.

The debate

Who carried out the sarin attacks during the Syrian civil war?

  • Rootclaim will argue that opposition forces were responsible.
  • Will anyone defend the commonly accepted hypothesis that the Syrian government was responsible? 

This is the conclusion reached by the US government, Britain, France, and the joint investigation by the United Nations and OPCW (Organization for the Prohibition of Chemical Weapons).

Do you have another hypothesis (e.g. Russia did it, or that some attacks were by the Syrian government while others were by the opposition)? Write to us and we’ll consider it.

The stakes: $100,000 each

This is the first in a series of Rootclaim Challenges, modeled after projects such as James Randi’s million dollar challenge, offered to anyone who can demonstrate paranormal powers in a lab setting (all attempts failed). To deter repeated submissions with the intention of winning by luck, we require the challenger to risk the same amount. Applicants who can’t afford to risk $100,000 are encouraged to pool funds together or even crowdfund it. We are willing to reduce the stakes as low as $10,000 for applicants already involved in public debate on the issue.

The motivation here is not to make money, but to elevate the level of public discourse (read about how challenges like this may help people reevaluate their positions, something that never happens in a heated online exchange).

Format

Both sides will first agree on two judges with strong analytical skills, relevant experience, no previous endorsement of either side, no relevant political biases, and who declare they will examine both hypotheses equally.

Choosing judges will be done publicly on Twitter, so evasion attempts by either side, such as offering biased judges, are exposed. As an example of our honest approach to this process, in a past discussion, when Nassim Taleb offered Glenn Greenwald as a judge, we agreed to bend the rules and accept him, even though he previously said there is “overwhelming” evidence the government is responsible (contrary to Rootclaim’s conclusion) – because we think he is capable of changing his mind when presented with evidence.

Each side will have 8 hours in total to present its case, including time to respond to the other side’s claims, as part of a two-day event.

The debate will be based on all currently available evidence. The goal here is not to trip up or trap the opponent, but to determine which hypothesis is better supported by the evidence. If you have new evidence, or evidence we overlooked, it should first be shared, so we can update the analysis, and if it doesn’t significantly change the conclusion, the challenge can be accepted. We are not claiming to have better evidence, but rather aim to demonstrate the superiority of probabilistic reasoning over human reasoning, when evaluating the same evidence.

Each judge has to declare which of the two hypotheses is more likely. If both agree, the prize pool, minus the debate expenses, is paid to the winner. Otherwise, it is split.

We are flexible – feel free to contact us with offers.

Who declined so far?

The following people have been sent a tweet offering to participate in the challenge but declined or failed to respond. All of them have publicly expressed very high confidence that the Syrian government is responsible.

  1. Eliot Higgins – Founder of Bellingcat.
  2. Brian Whitaker – Journalist and former Middle East editor of The Guardian.
  3. Chris York – Senior editor of Huffington Post UK.
  4. Josie Ensor – Middle East correspondent for The Telegraph.
  5. Scott Lucas – Editor of EA WorldView and Professor at University of Birmingham.
  6. Richard Hall – Middle East correspondent for The Independent.
  7. Julie Leranz – Senior adviser at The Israel Project and a director at The Human Security Centre.
  8. Kristyan Benedict – Amnesty International UK Campaigns Manager.
  9. Dan Kaszeta – Security and CBRN specialist and writer for Bellingcat.
  10. Tobias Schneider – Research fellow at Global Public Policy Institute (GPPi).
  11. Gregory Koblentz – Director of Biodefense Graduate Program at George Mason University.
  12. Numerous other individuals who were very active on social media discussing this issue.

Have you notified anyone of the challenge and they declined it? Let us know and we’ll add them to the list.

Treating Covid-19 with Vitamin D $100,000 Challenge

A study from October 2020, the first randomized controlled trial of its kind, showed that high doses of vitamin D (in the form of calcifediol) reduce the severity of Covid-19 in hospitalized patients. The researchers reported a 30-fold(!) reduction in intensive care admissions of Covid-19 patients. At Rootclaim, we analyzed these findings and concluded that even under conservative assumptions accounting for limitations in the study, the effect is still significant and likely around 5-fold. We further demonstrated that since the risks of treatment are low, this treatment protocol should be immediately implemented. Since we published our analysis, additional studies have supported this conclusion.

See Rootclaim’s complete analysis

Many health professionals, government officials, and other decision makers worldwide have seen the studies, but they have yet to update treatment guidelines. This delay may be due to the following:

  • Not many have the background in statistics and probability required to assess the data, and distinguish it from the dozens of false claims about COVID treatments.
  • They’re affected by omission bias – they default to the “safe” alternative of inaction, waiting for more data, rather than choosing action. It’s easier to later defend inaction than face criticism for acting too soon.
  • Their incentives are completely misaligned with the public. The damage to the public from using vitamin D when it isn’t effective is negligible, but the damage caused by inaction in the case that vitamin D is effective is enormous. To the decision maker in a personal capacity, the damage is similar in either case – one wrong decision on their record.
  • When it comes to low-risk, low-cost treatments, decision-makers hedging their bets on inaction leads to avoidable deaths. 

In this particular case the reasons to act now are clear:

  • Similar treatments have been performed for decades, and the risks are known to be low, especially in this setting, when patients can be monitored at the hospital.
  • The benefits of the treatment, on the other hand, are potentially enormous, effectively reducing Covid-19 severity to that of the seasonal flu.

While caution is often the correct path when dealing with public health, this is a case where decisions should be made swiftly, using the best available models. At Rootclaim, we develop such models so when our analysis exposed the implications of the new findings, we decided to promote the adoption of the proposed treatment. We hope that this unique challenge will allow the information to reach more decision makers, and save the millions of lives that will likely be lost while waiting for further studies.

The Challenge

Rootclaim is willing to bet $100,000 that vitamin D is effective in reducing the severity of Covid-19.

This is the second in a series of Rootclaim Challenges and is intended to show that the reluctance to implement a vitamin D protocol today is irrational. A decision maker who is not pushing to adopt the proposed protocol is effectively claiming that the probability that this protocol is better than existing treatments is low. But that also implies that taking the bet would be very profitable. Therefore, any professional not accepting this challenge is implicitly admitting that their decision not to promote the treatment is wrong.

UPDATE (Nov 2022): Since this challenge was published, in the early stages of the pandemic, multiple studies have been done on the subject, with the overwhelming majority finding vitamin D effective.
Over time, the virus has significantly changed its methods, and the population has changed due to vaccines and immunity. Therefore the analysis of vitamin D’s efficacy on the original virus and population is no longer relevant today and should be updated.

Since the pandemic is no longer a major risk, this update is not a priority for Rootclaim. Nevertheless, if you wish to debate the original analysis, please contact us to set the exact criteria.

Procedure

  • The challenger needs to show that they can commit $100,000. We are open to discussing lower or higher amounts, and the funds can be pooled from multiple sources.
  • Both sides will agree on an arbitrator who will review the evidence. 
  • The challenger needs to declare that they do not have access to any relevant non-public information. This is to protect from abuse in case of unpublished research (there is still a small chance that further research will discover the treatment is ineffective).
  • For the same reason, we may update these terms or withdraw the offer, as new information emerges. Of course, once a bet is made it is final and cannot be withdrawn.

If you’re not willing to risk your own money betting against vitamin D, why are you willing to risk someone else’s life?

Vitamin D Can Likely End the COVID-19 Pandemic

A Probabilistic Analysis of Recent Findings

On August 29, 2020, for the first time ever, a randomized controlled trial showed a significant and dramatic reduction in COVID-19 severity. 

Study participants that received a large dose of vitamin D (as calcifediol) experienced a 50-fold reduction in the odds of admissions to intensive care, which likely translates to a similar reduction in death rates (see further analysis). If these findings are accurate, the end of the pandemic is near. The study has multiple limitations that would normally warrant waiting for studies, but given the circumstances, it is important to dig deeper and accurately assess its implications. We will estimate the probability that the finding is true, and analyze the risks of adopting the treatment now vs. waiting for further studies.

Is the finding true?

A randomized controlled trial, where patients are randomly selected to receive the treatment or serve as control, makes it possible to isolate whether some clinical finding results from the treatment or from another factor. So far, there have been many studies on vitamin D and COVID-19, which demonstrated a strong link between the two, but causality had not been established. For example, people with poor health may have low vitamin D levels due to low sun exposure, creating a correlation with COVID-19 severity that is not causal.

We now have the results of the first randomized controlled trial on the effect of vitamin D on Covid-19 patients. If it was properly conducted, causality has finally been established, and an effective treatment was found. Unfortunately, the study has several limitations that may distort its result. 

Let’s review these possible problems, and their significance. A more mathematically rigorous analysis may be found in the appendix below.

1. The sample size is small, so the findings may be due to chance 

It is always possible that the patients that were randomly assigned to the treatment group suffered less deterioration by mere chance. This possibility is calculated using the p-value, which measures the probability of obtaining the study result (or stronger) by chance. The authors disclose it only as less than 1 in 1,000, but the actual number is less than 1 in 1,000,000 (can be verified here, using the study results of 13:13 vs 49:1).

It is important to understand that once a p-value has been obtained, the sample size no longer matters. The goal of a large sample is to reduce the random differences between the two groups, thus making the difference in treatment a larger factor in the final result. The p-value improves both with study size, and with effectiveness of the treatment.

In this case, the effect was so strong that the relatively small sample (76 people) turned out to be much larger than required.

It can be said with certainty that if the experimental results are incorrect, it is not because of the sample size or chance.

2. The control group included more people with risk factors

The control group happened to have significantly more people with hypertension, so it is expected they would have more admissions to intensive care. The researchers identified this issue and performed another analysis (logistic regression) that accounted for it, and the findings were only mildly weakened, from a 50-fold to a 30-fold reduction, with 95% confidence that the result is between 4-fold and 300-fold. We will use 12-fold as a conservative estimate.

We performed another analysis, which assumed that only those with high blood pressure could deteriorate (i.e. removing patients without hypertension from the sample), and the findings still remained very significant, with a p-value of 1 in 5,000, far better than the standard threshold of 1 in 20, or 0.05.

Another issue to evaluate is whether this imbalance indicates a deeper problem with randomization or reporting. The reported p-value of the difference in hypertension is 0.0023, meaning a 1:435 chance it would happen in a random assignment. However, this is just one of at least 10 parameters that could affect the study, and the p-value also accounts for an opposite effect (2-sided instead of 1-sided), so the probability that one of them would happen is only around 1:21, meaning 1 in 21 such studies would have such an imbalance by mere chance – hardly remarkable. Given that randomization was done electronically upon patient admission, such a mistake is unlikely, and as fraud it won’t make much sense (especially as it is later reported and corrected for).

This clearly seems like a chance occurrence, and we see no reason to reduce the estimate beyond what the investigators already did.

3. Patients in both groups were also treated with hydroxychloroquine and azithromycin

Patients in both groups received the standard treatment, which at the time was hydroxychloroquine and azithromycin, a treatment that has since fallen out of favor. Could it be that the findings result from vitamin D neutralizing negative effects of those drugs? This option is unlikely. Trials have shown differing results for hydroxychloroquine and azithromycin, with a few pointing only to a mild risk.

It is also possible that vitamin D only works in combination with the other treatments. Given these mechanisms of action, this is highly unlikely.

We estimate that, at most, this possibility reduces the effect from 12-fold to 8-fold (i.e. vitamin D may have neutralized a 50% increase in severity caused by the other drugs).

4. The experiment was not double-blind placebo-controlled

To prevent distortion of the results by the trial participants or the researchers (even unconsciously), it is preferable that neither know which patients were randomized to the control group and which to the treatment group. This was not the case in this experiment.

This is certainly a weakness of this study. It was mitigated by delegating the decision regarding transfer to intensive care to a committee of experts that included members of the hospital’s ethics committee, who were not aware which group the patient was assigned to, and reached decisions based on a structured protocol.

We have reached out to the investigators to learn more about the procedures, and learnt that this was a result of logistic problems in placebo manufacturing. We got the impression that an honest effort was made to mask the data as much as possible, and the two groups were not otherwise treated differently.

We still need to account for the possibility of outright fraud enabled by this weakness, in which case the findings are false. Since there are no commercial interests around vitamin D, and the fraud would be exposed in later studies, we assign this a probability of 10% at most.

5. There may be another, yet unidentified, factor 

Of course, there may be another source for the dramatic difference between the two groups, which has not yet been identified. This would usually be the responsibility of the publishing journal to expose. In this case, the publication has been peer-reviewed and published in a small journal specializing in vitamin D. The publisher is Elsevier, which also publishes the Lancet and Cell.

Such a major finding should ideally be published in a world-leading journal, but given the limitations above, and the likely urgency to publish, it is not unreasonable to choose a smaller journal.

Given the relative simplicity of the trial, we do not see unknown factors as a major risk, at most accounting for a further reduction from 8-fold to 6-fold, and a 10% probability of it invalidating the results.

6. Is the prior probability of the study findings low?

Equally important is the likelihood that vitamin D could cure Covid-19, based on the information known before the article was published. For example, if a study finds that five minutes of neck massage cures lung cancer, it is very likely that there is some error in the study, even if its statistical significance was high.

In this case, the opposite is true:

However, so far the indication has been for a weaker effect – about a 50% reduction in severity, not 30-fold, so the new finding indicating a near cure is initially surprising. But on further examination, there may not be any contradiction between the studies. A re-examination of a study that published detailed data shows that the rate of infection drops to nearly zero with high levels of vitamin D in the blood (above 50 ng/ml). That is, it is possible that the effectiveness increases with dose, and in the very high doses, as used in the study, near healing is achieved. 

It should also be noted that the earlier observational studies used vitamin D levels that were measured a significant time before infection. By the time patients got sick their levels may have changed, which would cause a possible strong correlation to appear weaker.

Another possibility is that the use of short term high dose calcifediol is more effective than the long term supplementation of vitamin D3.

Additionally, the investigators have informed us that the protocol has been used on patients after the trial completed, with similar results.

Overall, according to the prior knowledge, a mild effect is more likely than a strong or no effect, reducing our conservative estimate from 6-fold to 5-fold.

Summary – The findings are true

None of the possibilities mentioned invalidates the significant finding that emerges from the experiment. It is very possible that some minor biases occurred that exaggerated the effect, but it is unlikely that vitamin D had no positive effect.

Summarizing the numbers above, we estimate:

  • 20% probability that vitamin D has no significant effect on COVID-19 severity
  • 80% probability that it reduces severity and death, probably around 5-fold, and possibly much more.

Risk Management

In order to make a treatment policy decision, one must consider not only the likelihood that the finding is true, but also the potential harm and benefits of each possible course of action.

Alternative 1 – Wait

The easy decision is to wait for further studies to verify the new finding. This is what medical experts would normally decide after a first publication of a successful trial.

If the treatment is ineffective, there are no costs and risks to this decision.

If the treatment is effective, then based on the analysis above, the results in the study’s control group, and typical outcomes for hospitalized patients, the harm to a typical hospitalized patient, can be estimated as:

  • Additional 20% chance of suffering severe disease, with likely long-term implications.
  • Additional 5% chance of death

Alternative 2 – Adopt treatment

The second alternative is to immediately adopt the protocol for hospitalized patients. In this case the harm to patients is from the large vitamin D dose (whether or not the treatment is effective).

As vitamin D is already a popular treatment, there is abundant information on its risks.

  • The dose used in the study is about 10 times the maximum recommended dose for prolonged use.

However, the treatment protocol in the study is relatively short – until release of the patient or transfer to intensive care. Previous studies on short treatments at similar doses found them to be safe.

  • The risk in vitamin D is with increased use that maintains very high levels in the blood over a long period of time.

Even then, the risks are relatively limited, and can be corrected by a low-calcium diet and steroids. For hospitalized patients that can be monitored closely the risk is likely further reduced.

  • Covid-19 specific risk: vitamin D increases the expression of ACE2 in cells, which acts as a receptor for the coronavirus. Therefore, until now, there has been apprehension about its use. Since the new trial focused on COVID-19 patients and doesn’t show such negative effects, the concern seems to have been alleviated. There is still some low likelihood that the study results were completely wrong, either intentionally or due to a catastrophic mistake  that hid a worse outcome in the treatment group.

Based on existing knowledge, the risks in the proposed protocol appear to be low.

The risk can be further reduced by monitoring vitamin D levels in the patients’ blood, and keeping them in a high yet safe range, for example 80 ng/ml.

It is safe to assume the risks of the protocol are much lower than:

  • 5% chance of severe complications.
  • 1% chance of death

Conclusion

Given that both:

  • The likelihood that the treatment is very effective is greater than 50%;
  • The benefit of the treatment, if effective, is far higher than twice the risk of the treatment;

it is obvious that the right decision is immediate adoption of the treatment protocol.

Hospitals deciding to wait for further studies should have very strong reasoning that outweighs the apparent harm to patients by delaying treatment.

Global Implications on the COVID-19 pandemic

This analysis shows that if the protocol is widely adopted, COVID-19 severity can likely be reduced to that of the seasonal flu, allowing alleviation of certain limitations, which could bring a major improvement in the economy and social health.

A further conclusion, although with lower confidence, is that vitamin D could be effective at earlier stages of the disease. Previous studies have shown a correlation between high vitamin D levels and lower infection rates. The new study establishes a causal connection at late stages, increasing the likelihood that the correlation at earlier stages is also causal. This would mean that widespread vitamin D therapy (e.g. bringing blood levels to a healthy 30-40 ng/ml) could reduce R0. If that reduction is as significant as indicated by the studies, R0 could drop below 1, and stop the pandemic. 

Since vitamin D deficiency is already common, and risks are negligible at this dose, governments should immediately encourage and subsidize vitamin D tests and supplementation for the general population.

UPDATE: Following this analysis, Rootclaim is offering a $100,000 bet that vitamin D cures COVID-19 in order to show that the reluctance to immediately implement a vitamin D protocol is irrational.

Update 12 November 2020: An MIT study that went deeper into the statistical aspects of the trial has reached a similar conclusion that the results of the Cordoba trial are reliable, and that vitamin D treatment is the likely explanation for the dramatic reduction in ICU admissions of hospitalized Covid-19 patients.

Update 24 November 2020: Two additional double-blind, randomized, placebo-controlled trials have reached opposing conclusions regarding vitamin D and COVID-19. One study (printed in The BMJ) showed that those receiving a high dose of vitamin D were dramatically more likely to test negative for the virus within 21 days (21% vs 62%). The other study (preprint on medrxiv) reported that vitamin D supplementation did not significantly reduce hospital length of stay for patients with COVID-19.

Our analysis of the second study shows it does not significantly change the picture, and we maintain our contention that vitamin D should be immediately adopted as a treatment and prophylaxis for COVID-19.

The main flaws are that the study was designed in a way that had a low probability of achieving any of its endpoints, and that the treatment protocol itself was not suitable to demonstrate the efficacy of vitamin D.

  1. The study assumed that, if vitamin D were effective, it would reduce hospital stay from a mean of 7 to 3.5 days. That is an unreasonable expectation, especially given that bolus vitamin D takes a day or two to be mostly converted to 25(OH)D (calcifediol), and may take even longer for 1,25(OH)D. Previous trials were based on longer periods, or used calcifediol directly.
  2. Due to low mortality rates in the study, the study was incapable of detecting a significant effect. Even if there were zero deaths in the treatment group, the result would still be considered not significant (i.e. p>0.05), The study had only a marginally better chance of detecting an effect in ICU admissions or mechanical ventilation, and indeed there it showed some effect, although it is still not significant (as expected).
  3. The primary measure was length of hospital stay, which can be misleading. A short hospital stay could signify either a positive outcome due to improved healing or a negative outcome as with a quick death.
  4. Patients were recruited 10 days after symptoms began, and 90% were already on oxygen. It is possible that vitamin D’s effects are not very relevant at that point, so the failure to improve patient outcomes at a late stage does not reflect the efficacy at earlier stages.
  5. The effects of the vitamin D treatment could have been counteracted by the administration of steroids (to 62% of patients in the study), which weaken immune system activity.

While the study cannot demonstrate vitamin D is ineffective, due to its flawed design, it does suggest that at a late stage, alongside steroids, vitamin D is not immensely effective, i.e. it does not reduce the odds of severe outcomes by 5x or more. Our analysis at Rootclaim suggests that a 5x reduction is a reasonable outcome when vitamin D is administered correctly.

Update 24 May: A retrospective study on hospitalized patients with COVID-19 who received calcifediol showed a drop in mortality rate from 20% to 5%.Appendix – Bayesian Analysis

For those with a background in probability, following is a more rigorous analysis using Bayesian inference. By explicitly stating prior probabilities of hypotheses, and calculating the conditional probabilities of the study results under each hypothesis, a more accurate and robust result is achieved, removing the need to analyze sample sizes, p-values, or confidence intervals.

Hypotheses

We will define five hypotheses to be considered:

  • Damage – Vitamin D worsens COVID-19.
  • Nothing – No effect
  • 2-fold – Vitamin D reduces the odds for severe COVID-19 by around 2.
  • 5-fold – Vitamin D reduces the odds for severe COVID-19 by around 5.
  • 20-fold – Vitamin D reduces the odds for severe COVID-19 by around 20.

Prior

First we shall estimate the probability of each hypothesis based on what was known before the new study. As a baseline, few drugs are effective for any specific disease, but as described above, there are multiple studies showing correlation between vitamin D and COVID-19, and several proposed mechanisms of actions. On the flip side, there is the aforementioned risk that vitamin D could actually exacerbate COVID-19 by increasing ACE2.

We will represent these facts with the following prior probabilities:

  • Damage – 10%
  • Nothing – 67%
  • 2-fold – 15%
  • 5-fold – 5%
  • 20-fold – 3%

Adjustments to Study

Given the limitations discussed above, we will make the following adjustments to the study results:

  • Move 2 cases from ICU to non-ICU in the control group, which we attribute to the higher hypertension cases there.
  • Move 2 cases from non-ICU to ICU within the treatment group, and do the opposite in the control group, due to unknown weaknesses not yet identified.
  • Estimate at 20%, as above, the probability that the study was grossly mismanaged, and should be ignored.

So instead of the reported matrix of:

Vitamin DControl
Admitted to ICU113
Not admitted to ICU4913

We will use:

Vitamin DControl
Admitted to ICU39
Not admitted to ICU4717

Conditional Probabilities

Next we estimate the probability of getting the adjusted study results, under each of the five hypotheses. To do that, we will use the odds of the control group (9:17 = 9/26 = 34.6%), and adjust by the hypothesis factor, to receive the expected odds in the treatment group. For example, the expected odds in the 2-fold hypotheses would be 9:17*2 = 9:34, or a probability of 20.9%. We then use a binomial distribution formula to estimate the conditional probability of getting the exact study result (3 out of 50 trials) given those expected odds. This is then normalized to sum 100%. Lastly we average with the prior probabilities at a weight of 20%:80%, accounting for the 20% possibility that the study is meaningless.

The full calculation:

HypothesisDamageNothing2-fold5-fold20-fold
Prior probability10%67%15%5%3%
Odds ratio (OR)0.712520
Convert odds
to probability =
9/(9+17*OR)
0.4310.3460.2090.0960.026
Conditional probability
from binomial formula
000.00290.15180.0985
Posterior =
Prior * Conditional
000.00040.00760.003
Posterior,
normalized to 100%
0.0%0.0%4.0%69.1%26.9%
Account for 20%
failed study possibility
(final result)
2.0%13.4%6.2%56.3%22.1%

Summary

This more rigorous analysis reaches a very similar conclusion of around 80% likelihood that vitamin D is effective against COVID-19, with a 5-fold reduction being the most probable.

« Older posts

© 2024 Rootclaim Blog

Theme by Anders NorenUp ↑